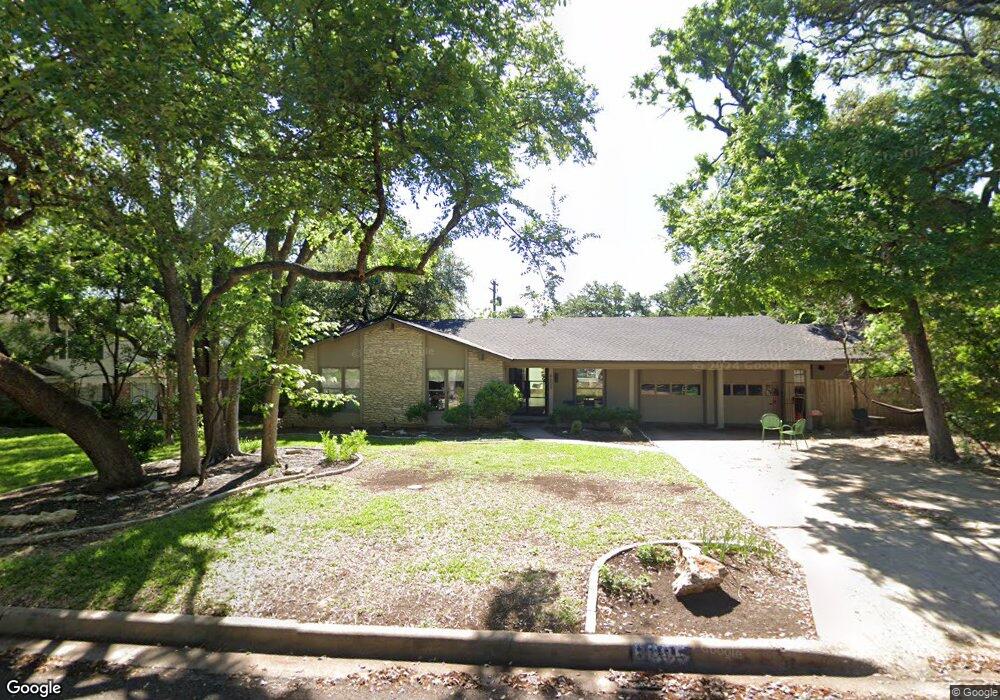
8605 Oakmountain Cir Austin, TX 78759
Westover Hills NeighborhoodEstimated Value: $848,079 - $951,000
--
Bed
3
Baths
2,397
Sq Ft
$384/Sq Ft
Est. Value
About This Home
This home is located at 8605 Oakmountain Cir, Austin, TX 78759 and is currently estimated at $920,020, approximately $383 per square foot. 8605 Oakmountain Cir is a home located in Travis County with nearby schools including Hill Elementary School, Murchison Middle School, and Anderson High School.
Ownership History
Date
Name
Owned For
Owner Type
Purchase Details
Closed on
Aug 27, 2014
Sold by
Renzi Anthony L and Renzi Vida Leslie Stephen
Bought by
Luckett Peyton Gray and Luckett Med
Current Estimated Value
Home Financials for this Owner
Home Financials are based on the most recent Mortgage that was taken out on this home.
Original Mortgage
$250,000
Outstanding Balance
$191,603
Interest Rate
4.17%
Mortgage Type
New Conventional
Estimated Equity
$728,417
Purchase Details
Closed on
Dec 31, 1993
Sold by
Yzaguirre Stephen John E and Yzaguirre Stephen Gloria
Bought by
Stephen Vida Leslie
Purchase Details
Closed on
Dec 30, 1992
Sold by
Yzaguirre Stephen John E and Yzaguirre Stephen Gloria
Bought by
Stephen Vida Leslie
Purchase Details
Closed on
Dec 31, 1991
Sold by
Yzaguirre Stephen John E and Yzaguirre Stephen Gloria
Bought by
Stephen Vida Leslie
Purchase Details
Closed on
Dec 31, 1990
Sold by
Yzaguirre Stephen John E and Yzaguirre Stephen Gloria
Bought by
Stephen Vida Leslie
Create a Home Valuation Report for This Property
The Home Valuation Report is an in-depth analysis detailing your home's value as well as a comparison with similar homes in the area
Home Values in the Area
Average Home Value in this Area
Purchase History
| Date | Buyer | Sale Price | Title Company |
|---|---|---|---|
| Luckett Peyton Gray | -- | Chicago Title | |
| Stephen Vida Leslie | -- | -- | |
| Stephen Vida Leslie | -- | -- | |
| Stephen Vida Leslie | -- | -- | |
| Stephen Vida Leslie | -- | -- |
Source: Public Records
Mortgage History
| Date | Status | Borrower | Loan Amount |
|---|---|---|---|
| Open | Luckett Peyton Gray | $250,000 |
Source: Public Records
Tax History Compared to Growth
Tax History
| Year | Tax Paid | Tax Assessment Tax Assessment Total Assessment is a certain percentage of the fair market value that is determined by local assessors to be the total taxable value of land and additions on the property. | Land | Improvement |
|---|---|---|---|---|
| 2025 | $13,774 | $792,483 | $497,318 | $295,165 |
| 2023 | $14,016 | $908,148 | $500,000 | $408,148 |
| 2022 | $23,195 | $1,174,478 | $500,000 | $674,478 |
| 2021 | $12,696 | $583,283 | $350,000 | $334,858 |
| 2020 | $11,373 | $530,257 | $350,000 | $180,257 |
| 2018 | $10,947 | $494,455 | $350,000 | $144,455 |
| 2017 | $11,913 | $534,191 | $200,000 | $335,888 |
| 2016 | $10,830 | $485,628 | $200,000 | $285,628 |
| 2015 | $10,072 | $450,000 | $200,000 | $250,000 |
| 2014 | $10,072 | $453,318 | $0 | $0 |
Source: Public Records
Map
Nearby Homes
- 8801 Tallwood Dr Unit B
- 8888 Tallwood Dr Unit 1202
- 8888 Tallwood Dr Unit 2206
- 8888 Tallwood Dr Unit 3207
- 8888 Tallwood Dr Unit 2111
- 8320 Greenslope Dr Unit B
- 3610 Branigan Ln
- 8304 Bradford Edward Cove Unit B
- 8314 Bent Tree Rd
- 8705 Silverhill Ln
- 3700 Steck Ave
- 8210 Bent Tree Rd Unit 138
- 8210 Bent Tree Rd Unit 226
- 8714 Ridgehill Dr
- 8121 Greenslope Dr
- 8900 Point Dr W
- 8900 Rockcrest Dr
- 8151 Meandering Way
- 8702 Wildridge Dr
- 3615 Summit Bend
- 8607 Oakmountain Cir
- 8603 Oakmountain Cir
- 8612 Honeysuckle Trail
- 8614 Honeysuckle Trail
- 8610 Honeysuckle Trail
- 8604 Oakmountain Cir
- 8616 Honeysuckle Trail
- 8601 Oakmountain Cir
- 8602 Oakmountain Cir
- 8700 Oakmountain Cir
- 3803 Hyridge Dr
- 8600 Oakmountain Cir
- 8615 Honeysuckle Trail
- 8613 Honeysuckle Trail
- 8700 Honeysuckle Trail
- 8524 Etienne Cove
- 8516 Etienne Cove
- 8520 Etienne Cove
- 8617 Honeysuckle Trail