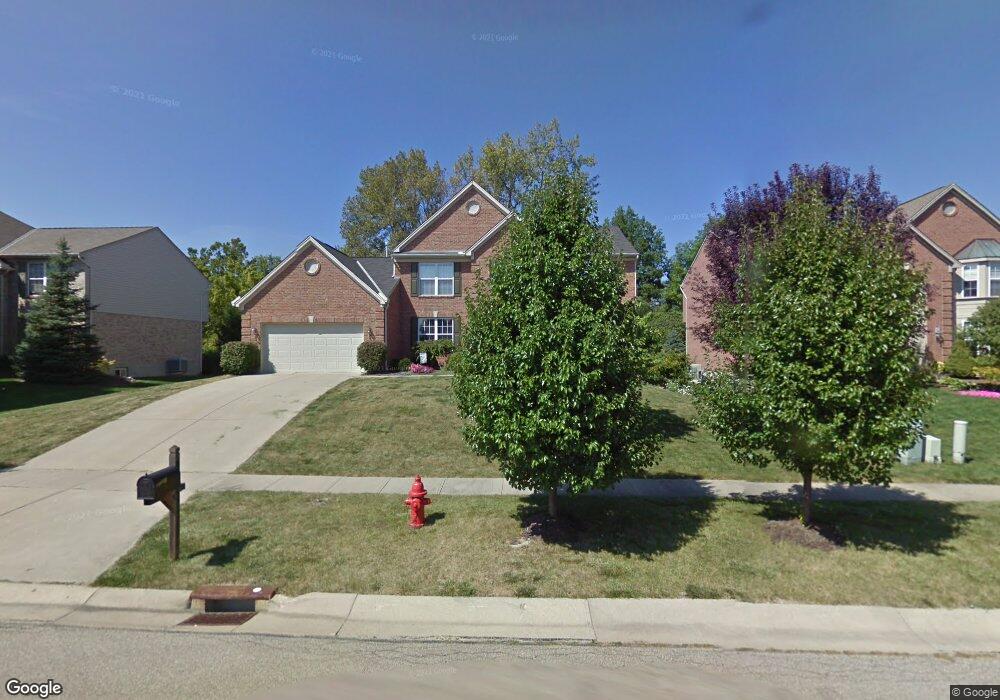
8607 Charleston Ridge Dr Unit 191 Mason, OH 45040
Deerfield Township NeighborhoodEstimated Value: $656,000 - $674,000
4
Beds
3
Baths
2,778
Sq Ft
$240/Sq Ft
Est. Value
About This Home
This home is located at 8607 Charleston Ridge Dr Unit 191, Mason, OH 45040 and is currently estimated at $665,880, approximately $239 per square foot. 8607 Charleston Ridge Dr Unit 191 is a home located in Warren County with nearby schools including Mason Intermediate Elementary School, Mason Middle School, and William Mason High School.
Ownership History
Date
Name
Owned For
Owner Type
Purchase Details
Closed on
Jun 12, 2020
Sold by
Ganaway Karyn M
Bought by
Mcclellan Sean Eric and Mcclellan Janese Ajali
Current Estimated Value
Home Financials for this Owner
Home Financials are based on the most recent Mortgage that was taken out on this home.
Original Mortgage
$333,200
Interest Rate
3.2%
Mortgage Type
New Conventional
Purchase Details
Closed on
Jun 5, 2000
Sold by
Zicka Walker Homes Inc
Bought by
Ganaway Michael D and Ganaway Karyn M
Home Financials for this Owner
Home Financials are based on the most recent Mortgage that was taken out on this home.
Original Mortgage
$235,200
Interest Rate
8.18%
Mortgage Type
New Conventional
Purchase Details
Closed on
Mar 9, 2000
Sold by
Monogram Communities Inc
Bought by
Zicka Walker Homes Inc
Create a Home Valuation Report for This Property
The Home Valuation Report is an in-depth analysis detailing your home's value as well as a comparison with similar homes in the area
Home Values in the Area
Average Home Value in this Area
Purchase History
| Date | Buyer | Sale Price | Title Company |
|---|---|---|---|
| Mcclellan Sean Eric | $392,000 | Lawyers Title Of Cincinnati | |
| Ganaway Michael D | $261,000 | -- | |
| Zicka Walker Homes Inc | $183,456 | -- |
Source: Public Records
Mortgage History
| Date | Status | Borrower | Loan Amount |
|---|---|---|---|
| Previous Owner | Mcclellan Sean Eric | $333,200 | |
| Previous Owner | Ganaway Michael D | $235,200 |
Source: Public Records
Tax History Compared to Growth
Tax History
| Year | Tax Paid | Tax Assessment Tax Assessment Total Assessment is a certain percentage of the fair market value that is determined by local assessors to be the total taxable value of land and additions on the property. | Land | Improvement |
|---|---|---|---|---|
| 2024 | $7,587 | $176,510 | $45,500 | $131,010 |
| 2023 | $6,621 | $126,770 | $23,100 | $103,670 |
| 2022 | $6,508 | $126,770 | $23,100 | $103,670 |
| 2021 | $6,192 | $126,770 | $23,100 | $103,670 |
| 2020 | $6,623 | $115,245 | $21,000 | $94,245 |
| 2019 | $6,140 | $115,245 | $21,000 | $94,245 |
| 2018 | $6,165 | $115,245 | $21,000 | $94,245 |
| 2017 | $6,302 | $108,710 | $21,984 | $86,727 |
| 2016 | $6,477 | $108,710 | $21,984 | $86,727 |
| 2015 | $6,413 | $108,710 | $21,984 | $86,727 |
| 2014 | $5,986 | $93,720 | $18,950 | $74,760 |
| 2013 | $5,999 | $103,840 | $21,000 | $82,840 |
Source: Public Records
Map
Nearby Homes
- 8606 Charleston Valley Dr
- 8655 Charleston Creek Dr
- 8820 Butler Warren Rd
- 8830 Butler Warren Rd
- Margot Plan at Losh Landing - Masterpiece Collection
- Mitchell Plan at Losh Landing - Masterpiece Collection
- Clay Plan at Losh Landing - Masterpiece Collection
- Huxley Plan at Losh Landing - Masterpiece Collection
- Leland Plan at Losh Landing - Masterpiece Collection
- Beckett Plan at Losh Landing - Masterpiece Collection
- Paxton Plan at Losh Landing - Masterpiece Collection
- Winslow Plan at Losh Landing - Masterpiece Collection
- Teagan Plan at Losh Landing - Masterpiece Collection
- Pearson Plan at Losh Landing - Masterpiece Collection
- 8905 Suncrest Ln
- 8224 Summer View Dr
- 8178 Stone Dr
- 8391 Dimmick Rd
- 8141 Stone Dr
- 9509 Butler Warren Rd
- 8607 Charleston Ridge Dr
- 8621 Charleston Ridge Dr
- 8573 Charleston Ridge Dr
- 8637 Charleston Ridge Dr
- 8624 Charleston Ridge Dr
- 8636 Charleston Meadows
- 8636 Charleston Meadows Unit 203
- 6850 Plainview Dr
- 8655 Charleston Ridge Dr
- 8640 Charleston Ridge Dr
- 8572 Charleston Ridge Dr
- 6879 Plainview Dr
- 6868 Plainview Dr
- 8661 Charleston Meadows
- 8648 Charleston Meadows
- 6884 Plainview Dr
- 8671 Charleston Ridge Dr
- 8541 Charleston Ridge Dr
- 8656 Charleston Ridge Dr
- 8656 Charleston Ridge Dr Unit 238