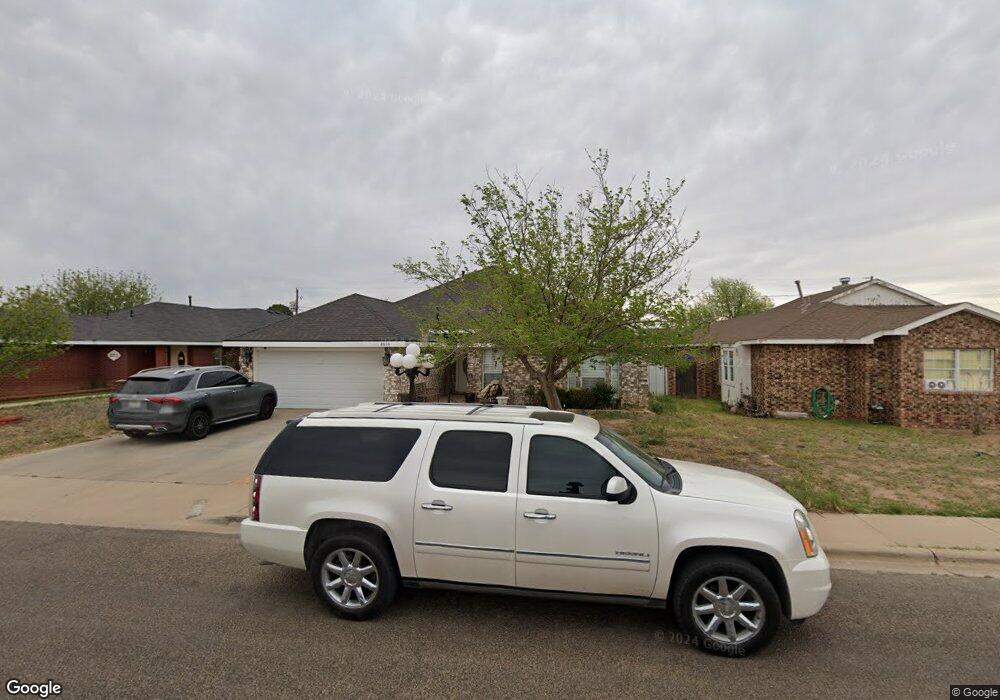
8608 Duke Ave Odessa, TX 79765
East Park NeighborhoodEstimated Value: $284,000 - $341,000
--
Bed
--
Bath
2,300
Sq Ft
$136/Sq Ft
Est. Value
About This Home
This home is located at 8608 Duke Ave, Odessa, TX 79765 and is currently estimated at $311,871, approximately $135 per square foot. 8608 Duke Ave is a home located in Ector County with nearby schools including Lee Buice Elementary School, Wilson & Young Medal of Honor Middle School, and Permian High School.
Ownership History
Date
Name
Owned For
Owner Type
Purchase Details
Closed on
Dec 21, 2011
Sold by
Armendariz Martin and Armendariz Obidea
Bought by
Castaneda Raul and Castaneda Valentina
Current Estimated Value
Home Financials for this Owner
Home Financials are based on the most recent Mortgage that was taken out on this home.
Original Mortgage
$28,000
Interest Rate
4.02%
Mortgage Type
Purchase Money Mortgage
Purchase Details
Closed on
Nov 2, 2005
Sold by
Chavez Leroy
Bought by
Castaneda Raul
Create a Home Valuation Report for This Property
The Home Valuation Report is an in-depth analysis detailing your home's value as well as a comparison with similar homes in the area
Home Values in the Area
Average Home Value in this Area
Purchase History
| Date | Buyer | Sale Price | Title Company |
|---|---|---|---|
| Castaneda Raul | -- | None Available | |
| Castaneda Raul | -- | None Available |
Source: Public Records
Mortgage History
| Date | Status | Borrower | Loan Amount |
|---|---|---|---|
| Closed | Castaneda Raul | $28,000 |
Source: Public Records
Tax History Compared to Growth
Tax History
| Year | Tax Paid | Tax Assessment Tax Assessment Total Assessment is a certain percentage of the fair market value that is determined by local assessors to be the total taxable value of land and additions on the property. | Land | Improvement |
|---|---|---|---|---|
| 2024 | $4,480 | $323,930 | $18,169 | $305,761 |
| 2023 | $4,283 | $312,442 | $18,169 | $294,273 |
| 2022 | $7,366 | $318,816 | $20,734 | $298,082 |
| 2021 | $7,061 | $299,330 | $20,734 | $278,596 |
| 2020 | $6,571 | $283,337 | $13,181 | $270,156 |
| 2019 | $6,792 | $275,763 | $13,181 | $262,582 |
| 2018 | $5,896 | $250,419 | $13,181 | $237,238 |
| 2017 | $5,472 | $240,257 | $13,181 | $227,076 |
| 2016 | $5,334 | $240,257 | $13,181 | $227,076 |
| 2015 | $3,369 | $240,257 | $13,181 | $227,076 |
| 2014 | $3,369 | $229,326 | $13,181 | $216,145 |
Source: Public Records
Map
Nearby Homes