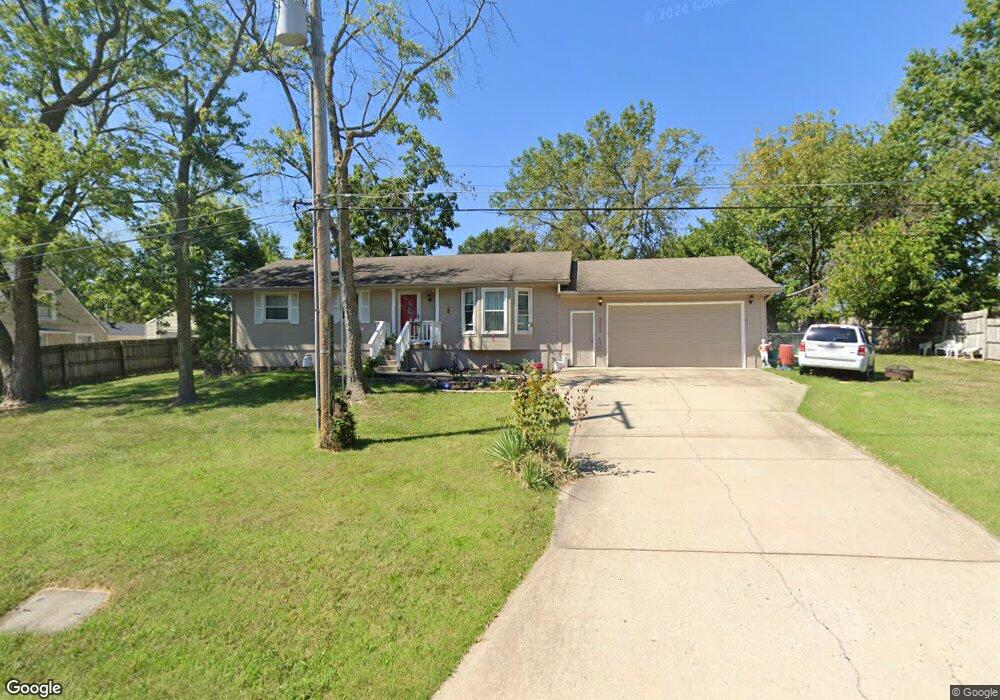
8608 Pershing Rd Raytown, MO 64138
Estimated Value: $218,000 - $251,000
3
Beds
2
Baths
1,190
Sq Ft
$200/Sq Ft
Est. Value
About This Home
This home is located at 8608 Pershing Rd, Raytown, MO 64138 and is currently estimated at $238,130, approximately $200 per square foot. 8608 Pershing Rd is a home located in Jackson County with nearby schools including Southwood Elementary, South Middle School, and Carver Christian Academy.
Ownership History
Date
Name
Owned For
Owner Type
Purchase Details
Closed on
Oct 24, 2022
Sold by
Danahy Ashley Nicole and Mathew Ryan
Bought by
Walker Sharon K
Current Estimated Value
Purchase Details
Closed on
Feb 5, 2021
Sold by
Walker Sharon K and Meisberger Sharon K
Bought by
Walker Sharon K and Danahy Ashley
Home Financials for this Owner
Home Financials are based on the most recent Mortgage that was taken out on this home.
Original Mortgage
$102,046
Interest Rate
2.65%
Mortgage Type
FHA
Purchase Details
Closed on
Feb 7, 1997
Sold by
Walker Merritt
Bought by
Meisberger Sharon K
Home Financials for this Owner
Home Financials are based on the most recent Mortgage that was taken out on this home.
Original Mortgage
$38,000
Interest Rate
7.19%
Mortgage Type
Purchase Money Mortgage
Create a Home Valuation Report for This Property
The Home Valuation Report is an in-depth analysis detailing your home's value as well as a comparison with similar homes in the area
Home Values in the Area
Average Home Value in this Area
Purchase History
| Date | Buyer | Sale Price | Title Company |
|---|---|---|---|
| Walker Sharon K | -- | -- | |
| Walker Sharon K | -- | Inspire Closing Services | |
| Meisberger Sharon K | -- | Assured Quality Title Compan |
Source: Public Records
Mortgage History
| Date | Status | Borrower | Loan Amount |
|---|---|---|---|
| Previous Owner | Walker Sharon K | $102,046 | |
| Previous Owner | Meisberger Sharon K | $38,000 |
Source: Public Records
Tax History
| Year | Tax Paid | Tax Assessment Tax Assessment Total Assessment is a certain percentage of the fair market value that is determined by local assessors to be the total taxable value of land and additions on the property. | Land | Improvement |
|---|---|---|---|---|
| 2025 | $2,610 | $33,271 | $7,410 | $25,861 |
| 2024 | $2,592 | $28,931 | $5,252 | $23,679 |
| 2023 | $2,592 | $28,931 | $4,706 | $24,225 |
| 2022 | $2,681 | $28,500 | $3,962 | $24,538 |
| 2021 | $2,690 | $28,500 | $3,962 | $24,538 |
| 2020 | $2,582 | $27,097 | $3,962 | $23,135 |
| 2019 | $2,568 | $27,097 | $3,962 | $23,135 |
| 2018 | $1,904 | $20,805 | $4,353 | $16,452 |
| 2017 | $1,904 | $20,805 | $4,353 | $16,452 |
| 2016 | $1,722 | $18,924 | $2,544 | $16,380 |
Source: Public Records
Map
Nearby Homes
- 8505 Pershing Rd
- 8324 Pershing Rd
- 8531 Vassar Ave
- 8401 Sterling Ave
- 6406 E 87 St
- 8718 Ridgeway Ct
- 8408 Woodson Ct
- 11104 E 83rd Terrace
- 12007 E 86th St
- 8401 Northern St
- 8306 Northern St
- 8300 Northern St
- 8711 Crysler Ave
- 8220 Willow Way
- 0 Ash Ave
- 8001 Westridge Rd Unit 102
- 7923 Harris Ave
- 10308 E 81st St
- 10602 E 79th Terrace
- 7828 Westridge Rd
- 8614 Pershing Rd
- 8511 Pershing Rd
- 8509 Pershing Rd
- 8600 Pershing Rd
- 8515 Pershing Rd
- 8520 Pershing Rd
- 8538 Pershing Rd
- 8516 Pershing Rd
- 8535 Grant Dr
- 8519 Pershing Rd
- 11300 E 86th Terrace
- 8539 Grant Dr
- 8512 Pershing Rd
- 8616 Grant Dr
- 8510 Pershing Rd
- 8604 Grant Dr
- 8612 Grant Dr
- 8600 Grant Dr
- 8501 Grant Dr
- 11205 E 86th Terrace
Your Personal Tour Guide
Ask me questions while you tour the home.