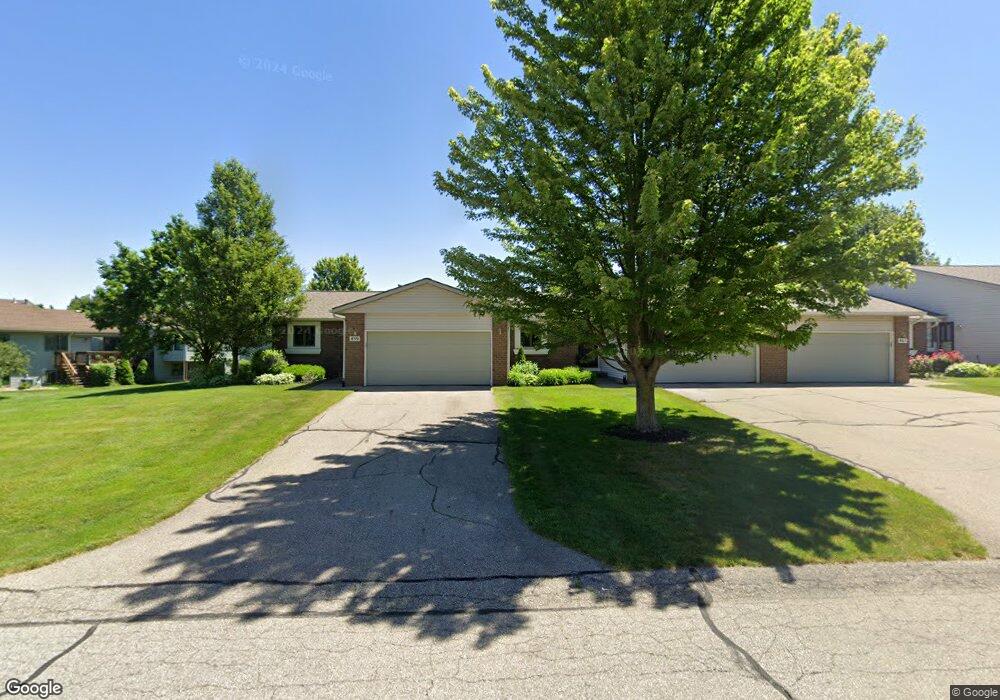
861 Creekridge Dr Unit 71 Holland, MI 49423
South Holland NeighborhoodEstimated Value: $261,721 - $288,000
2
Beds
1
Bath
1,064
Sq Ft
$260/Sq Ft
Est. Value
About This Home
This home is located at 861 Creekridge Dr Unit 71, Holland, MI 49423 and is currently estimated at $276,430, approximately $259 per square foot. 861 Creekridge Dr Unit 71 is a home located in Allegan County with nearby schools including Hamilton High School, Pine Ridge Christian School, and Calvary Schools of Holland - Plasman Campus.
Ownership History
Date
Name
Owned For
Owner Type
Purchase Details
Closed on
Dec 7, 2018
Sold by
Kuse Marsha A and Kuse Kenneth W
Bought by
Kuse Marsha A and Klomparens Bridget
Current Estimated Value
Purchase Details
Closed on
Jun 29, 2010
Sold by
Hemmeke Dena
Bought by
Kuse Kenneth W and Kuse Marsha A
Home Financials for this Owner
Home Financials are based on the most recent Mortgage that was taken out on this home.
Original Mortgage
$65,000
Outstanding Balance
$43,237
Interest Rate
4.74%
Mortgage Type
New Conventional
Estimated Equity
$233,193
Purchase Details
Closed on
Jan 3, 2006
Sold by
Hemmeke Dena
Bought by
Hemmeke Dena and Dena Hemmeke Declaration Of Trust
Purchase Details
Closed on
Aug 17, 1992
Create a Home Valuation Report for This Property
The Home Valuation Report is an in-depth analysis detailing your home's value as well as a comparison with similar homes in the area
Home Values in the Area
Average Home Value in this Area
Purchase History
| Date | Buyer | Sale Price | Title Company |
|---|---|---|---|
| Kuse Marsha A | -- | None Available | |
| Kuse Kenneth W | $75,000 | Lighthouse Title Inc | |
| Hemmeke Dena | -- | None Available | |
| Hemmeke Dena | -- | None Available | |
| -- | $82,900 | -- |
Source: Public Records
Mortgage History
| Date | Status | Borrower | Loan Amount |
|---|---|---|---|
| Open | Kuse Kenneth W | $65,000 |
Source: Public Records
Tax History Compared to Growth
Tax History
| Year | Tax Paid | Tax Assessment Tax Assessment Total Assessment is a certain percentage of the fair market value that is determined by local assessors to be the total taxable value of land and additions on the property. | Land | Improvement |
|---|---|---|---|---|
| 2025 | $1,485 | $115,500 | $47,500 | $68,000 |
| 2024 | $1,247 | $111,900 | $42,500 | $69,400 |
| 2023 | $1,247 | $94,800 | $32,500 | $62,300 |
| 2022 | $1,247 | $83,500 | $17,500 | $66,000 |
| 2021 | $1,251 | $81,300 | $17,500 | $63,800 |
| 2020 | $1,251 | $75,600 | $17,500 | $58,100 |
| 2019 | $0 | $70,500 | $10,000 | $60,500 |
| 2018 | $0 | $65,200 | $0 | $65,200 |
| 2017 | $0 | $65,100 | $0 | $65,100 |
| 2016 | $0 | $49,400 | $0 | $49,400 |
| 2015 | -- | $49,400 | $0 | $49,400 |
| 2014 | -- | $46,300 | $0 | $46,300 |
| 2013 | -- | $43,600 | $0 | $43,600 |
Source: Public Records
Map
Nearby Homes
- 886 Creekridge Dr
- 6147 Lake Wind Ave Unit lot 62
- 6096 147th Ave
- 766 Clarewood Ct
- 743 Crestview St
- 776 Meadowbrook Ave
- 663 Lugers Rd
- 655 Lugers Rd
- 6329 147th Ave
- V/L 60th St
- 879 W 26th St
- 646 Spring Ln
- 1092 S Shore Dr
- 6262 147th Ave
- 1130 S Shore Dr
- 828 Brook Village Dr
- 804 Brook Village Dr
- 814 Bertsch Dr
- 1092 Cobblestone Rd Unit 18
- 634 Blackbass Ave
- 865 Creekridge Dr
- 865 Creekridge Dr Unit 70
- 859 Creekridge Dr
- 867 Creekridge Dr
- 873 Creekridge Dr
- 950 Village Ct
- 954 Village Ct
- 956 Village Ct
- 938 Village Ct
- 948 Village Ct
- 862 Creekridge Dr
- 860 Creekridge Dr
- 936 Village Ct Unit 78
- 895 Creekridge Dr
- 895 Creekridge Dr Unit 66
- 854 Creekridge Dr Unit 44
- 872 Creekridge Dr
- 872 Creekridge Dr Unit 47
- 852 Creekridge Dr Unit 43
- 932 Village Ct