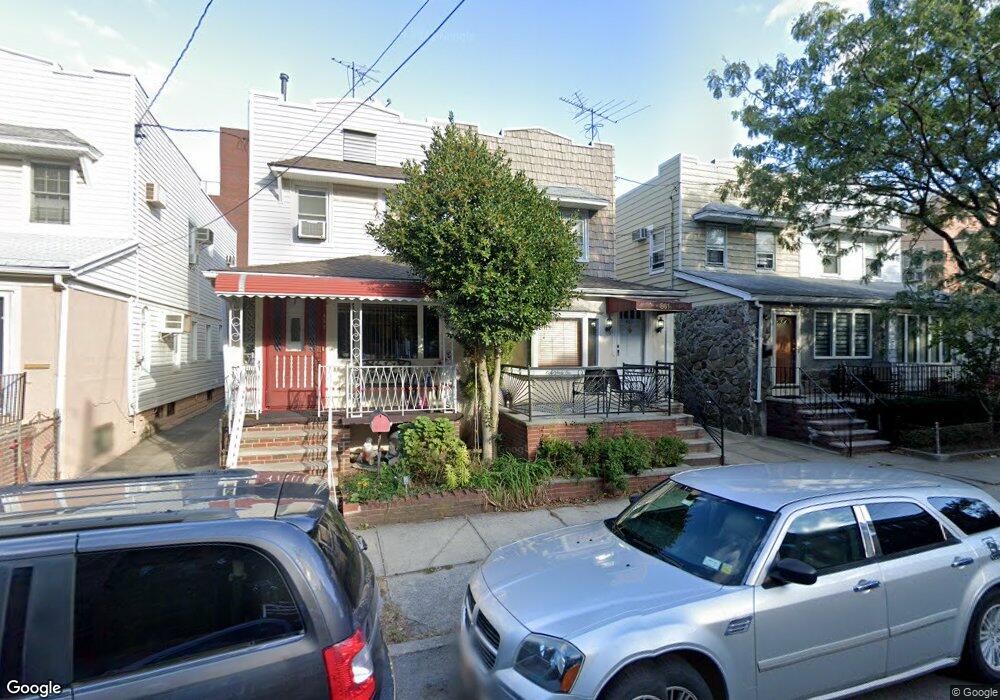
861 E 28th St Brooklyn, NY 11210
Midwood NeighborhoodEstimated Value: $854,000 - $1,021,811
Studio
--
Bath
1,440
Sq Ft
$646/Sq Ft
Est. Value
About This Home
This home is located at 861 E 28th St, Brooklyn, NY 11210 and is currently estimated at $930,453, approximately $646 per square foot. 861 E 28th St is a home located in Kings County with nearby schools including P.S. 315, School of Science and Technology, and J.H.S. 278 Marine Park.
Ownership History
Date
Name
Owned For
Owner Type
Purchase Details
Closed on
Nov 2, 2016
Sold by
Sadowsky Isaac
Bought by
Schwartz Moshe and Schwartz Tzipora
Current Estimated Value
Home Financials for this Owner
Home Financials are based on the most recent Mortgage that was taken out on this home.
Original Mortgage
$567,000
Outstanding Balance
$455,203
Interest Rate
3.42%
Mortgage Type
Purchase Money Mortgage
Estimated Equity
$475,250
Purchase Details
Closed on
Sep 24, 1998
Sold by
Kirschner Chaim
Bought by
Sadowsky Isaac
Home Financials for this Owner
Home Financials are based on the most recent Mortgage that was taken out on this home.
Original Mortgage
$140,000
Interest Rate
6.7%
Purchase Details
Closed on
Aug 1, 1995
Sold by
Nicotra June
Bought by
Kirschner Chaim and Kirschner Yitty
Home Financials for this Owner
Home Financials are based on the most recent Mortgage that was taken out on this home.
Original Mortgage
$140,000
Interest Rate
7.61%
Create a Home Valuation Report for This Property
The Home Valuation Report is an in-depth analysis detailing your home's value as well as a comparison with similar homes in the area
Home Values in the Area
Average Home Value in this Area
Purchase History
| Date | Buyer | Sale Price | Title Company |
|---|---|---|---|
| Schwartz Moshe | $630,000 | -- | |
| Sadowsky Isaac | $205,000 | Nations Title Insurance | |
| Kirschner Chaim | $175,500 | -- |
Source: Public Records
Mortgage History
| Date | Status | Borrower | Loan Amount |
|---|---|---|---|
| Open | Schwartz Moshe | $567,000 | |
| Previous Owner | Sadowsky Isaac | $140,000 | |
| Previous Owner | Kirschner Chaim | $140,000 |
Source: Public Records
Tax History
| Year | Tax Paid | Tax Assessment Tax Assessment Total Assessment is a certain percentage of the fair market value that is determined by local assessors to be the total taxable value of land and additions on the property. | Land | Improvement |
|---|---|---|---|---|
| 2025 | $6,908 | $58,080 | $17,520 | $40,560 |
| 2024 | $6,908 | $53,460 | $17,520 | $35,940 |
| 2023 | $6,636 | $54,840 | $17,520 | $37,320 |
| 2022 | $6,179 | $48,060 | $17,520 | $30,540 |
| 2021 | $6,153 | $45,900 | $17,520 | $28,380 |
| 2019 | $5,996 | $37,320 | $17,520 | $19,800 |
| 2018 | $5,550 | $27,228 | $11,261 | $15,967 |
| 2017 | $4,959 | $25,795 | $10,916 | $14,879 |
| 2016 | $4,561 | $24,364 | $12,245 | $12,119 |
| 2015 | $2,715 | $24,358 | $15,784 | $8,574 |
| 2014 | $2,715 | $23,886 | $13,343 | $10,543 |
Source: Public Records
Map
Nearby Homes
- 909 E 29th St Unit 2-K
- 909 E 29th St Unit 3F
- 909 E 29th St Unit 3D
- 927 E 27th St
- 928 E 26th St
- 3108 Avenue I
- 145 Kenilworth Place Unit 3A
- 145 Kenilworth Place Unit 2A
- 945 E 32nd St
- 1533 - 1535 New York Ave
- 3098 Bedford Ave
- 1804 New York Ave
- 1006 E 31st St
- 3220 Avenue H Unit 4L
- 3220 Avenue H Unit 3
- 3220 Avenue H Unit 1J
- 3220 Avenue H Unit 6N
- 3220 Avenue H Unit 4B
- 3220 Avenue H Unit 1E
- 119 Amersfort Place
- 859 E 28th St
- 857 E 28th St
- 863 E 28th St
- 855 E 28th St
- 865 E 28th St
- 853 E 28th St
- 869 E 28th St
- 871 E 28th St
- 858 E 29th St
- 873 E 28th St
- 875 E 28th St
- 862 E 28th St
- 877 E 28th St
- 864 E 28th St
- 848 E 28th St Unit 39
- 848 E 28th St Unit B-2
- 848 E 28th St Unit 3C
- 848 E 28th St Unit D9
- 848 E 28th St Unit A-2
- 866 E 29th St
Your Personal Tour Guide
Ask me questions while you tour the home.