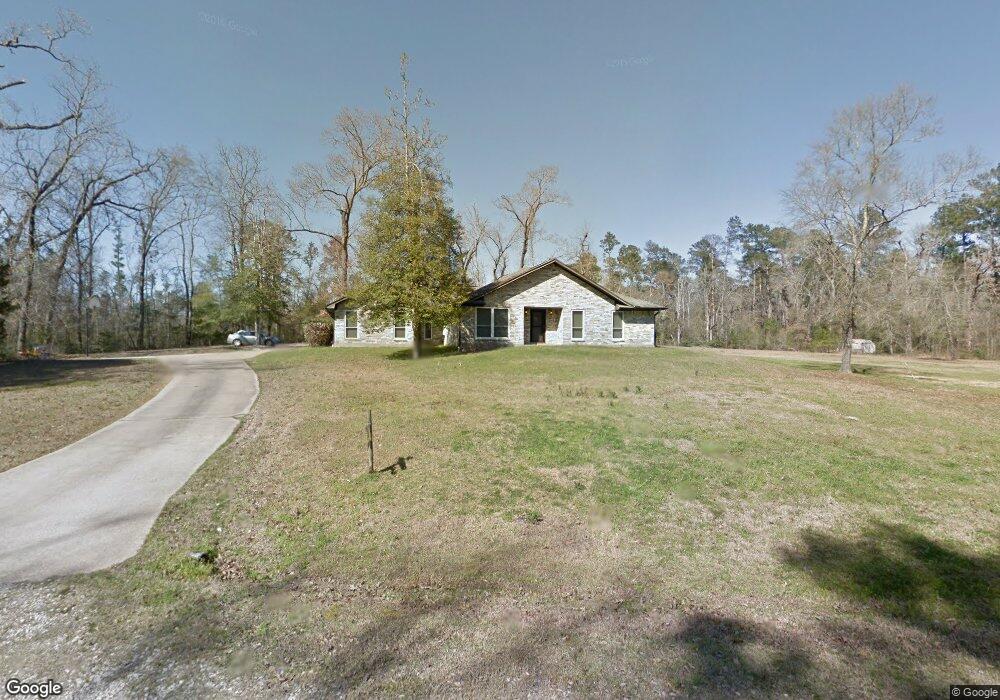
861 Hulsman Rd Lufkin, TX 75904
Estimated Value: $315,655 - $383,000
3
Beds
3
Baths
2,277
Sq Ft
$152/Sq Ft
Est. Value
About This Home
This home is located at 861 Hulsman Rd, Lufkin, TX 75904 and is currently estimated at $346,664, approximately $152 per square foot. 861 Hulsman Rd is a home located in Angelina County with nearby schools including W.F. Peavy Primary School, W.H. Bonner Elementary School, and Hudson Middle School.
Ownership History
Date
Name
Owned For
Owner Type
Purchase Details
Closed on
Aug 31, 2005
Sold by
Mitchell Bettie L and Mitchell William A
Bought by
Fennell Richard D and Fennell Charity
Current Estimated Value
Home Financials for this Owner
Home Financials are based on the most recent Mortgage that was taken out on this home.
Original Mortgage
$137,265
Outstanding Balance
$73,252
Interest Rate
5.81%
Mortgage Type
FHA
Estimated Equity
$273,412
Create a Home Valuation Report for This Property
The Home Valuation Report is an in-depth analysis detailing your home's value as well as a comparison with similar homes in the area
Home Values in the Area
Average Home Value in this Area
Purchase History
| Date | Buyer | Sale Price | Title Company |
|---|---|---|---|
| Fennell Richard D | $137,265 | Community Title |
Source: Public Records
Mortgage History
| Date | Status | Borrower | Loan Amount |
|---|---|---|---|
| Open | Fennell Richard D | $137,265 |
Source: Public Records
Tax History Compared to Growth
Tax History
| Year | Tax Paid | Tax Assessment Tax Assessment Total Assessment is a certain percentage of the fair market value that is determined by local assessors to be the total taxable value of land and additions on the property. | Land | Improvement |
|---|---|---|---|---|
| 2025 | $4,360 | $293,740 | $51,790 | $241,950 |
| 2024 | $4,265 | $287,310 | $51,790 | $235,520 |
| 2023 | $4,021 | $283,010 | $51,790 | $231,220 |
| 2022 | $4,126 | $249,820 | $36,990 | $212,830 |
| 2021 | $4,104 | $233,400 | $36,990 | $196,410 |
| 2020 | $3,678 | $200,260 | $20,400 | $179,860 |
| 2019 | $3,731 | $196,550 | $19,800 | $176,750 |
| 2018 | $3,112 | $190,830 | $19,800 | $171,030 |
| 2017 | $3,112 | $178,770 | $15,860 | $162,910 |
| 2016 | $3,307 | $172,150 | $15,860 | $156,290 |
| 2015 | $2,984 | $172,150 | $15,860 | $156,290 |
| 2014 | $2,984 | $170,710 | $15,860 | $154,850 |
Source: Public Records
Map
Nearby Homes