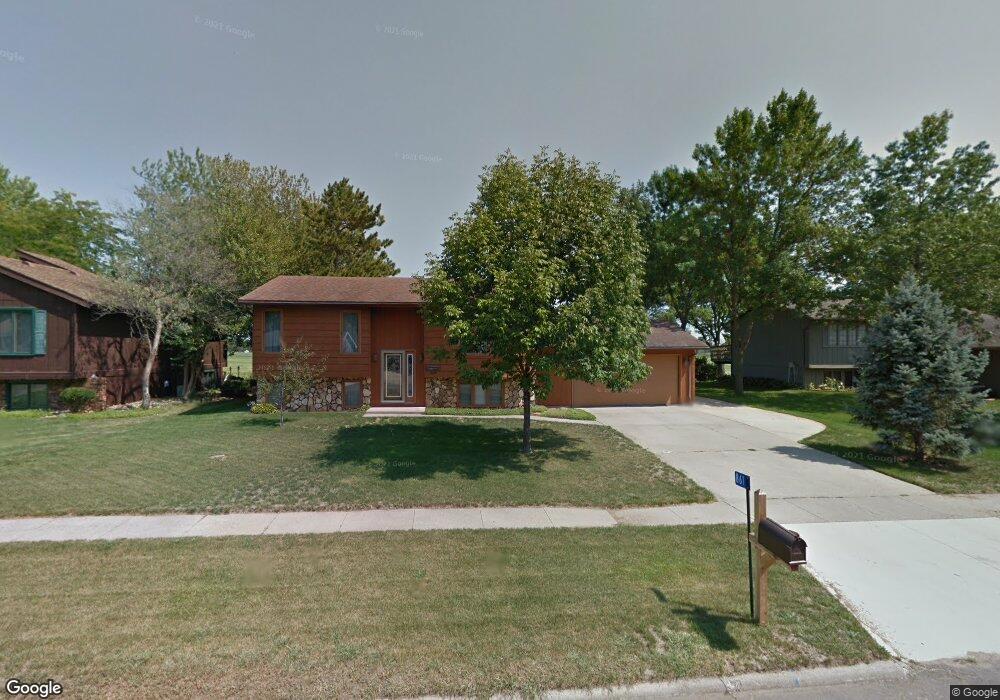
861 Juniper Dr Waterloo, IA 50702
Estimated Value: $204,000 - $297,000
2
Beds
2
Baths
929
Sq Ft
$257/Sq Ft
Est. Value
About This Home
This home is located at 861 Juniper Dr, Waterloo, IA 50702 and is currently estimated at $238,509, approximately $256 per square foot. 861 Juniper Dr is a home located in Black Hawk County with nearby schools including Orange Elementary School, Hoover Middle School, and West High School.
Ownership History
Date
Name
Owned For
Owner Type
Purchase Details
Closed on
Aug 27, 2009
Sold by
Kos Stephen J and Kos Shereen D
Bought by
Homeister Lee P and Homeister Shani J
Current Estimated Value
Home Financials for this Owner
Home Financials are based on the most recent Mortgage that was taken out on this home.
Original Mortgage
$182,139
Outstanding Balance
$119,119
Interest Rate
5.27%
Mortgage Type
FHA
Estimated Equity
$119,390
Create a Home Valuation Report for This Property
The Home Valuation Report is an in-depth analysis detailing your home's value as well as a comparison with similar homes in the area
Purchase History
We collect this data history from publicly available records. To have your information removed, we recommend requesting removal directly through your county’s website.
| Date | Buyer | Sale Price | Title Company |
|---|---|---|---|
| Homeister Lee P | $185,500 | None Available |
Source: Public Records
Mortgage History
We collect this data history from publicly available records. To have your information removed, we recommend requesting removal directly through your county’s website.
| Date | Status | Borrower | Loan Amount |
|---|---|---|---|
| Open | Homeister Lee P | $182,139 |
Source: Public Records
Tax History
| Year | Tax Paid | Tax Assessment Tax Assessment Total Assessment is a certain percentage of the fair market value that is determined by local assessors to be the total taxable value of land and additions on the property. | Land | Improvement |
|---|---|---|---|---|
| 2025 | $3,016 | $219,730 | $20,400 | $199,330 |
| 2024 | $3,016 | $235,100 | $20,400 | $214,700 |
| 2023 | $2,186 | $228,720 | $20,400 | $208,320 |
| 2022 | $2,280 | $171,250 | $20,400 | $150,850 |
| 2021 | $2,372 | $180,030 | $20,400 | $159,630 |
| 2020 | $2,374 | $172,960 | $16,320 | $156,640 |
| 2019 | $2,374 | $172,960 | $16,320 | $156,640 |
| 2018 | $2,278 | $162,020 | $16,320 | $145,700 |
| 2017 | $2,318 | $162,020 | $16,320 | $145,700 |
| 2016 | $2,290 | $162,020 | $16,320 | $145,700 |
| 2015 | $2,290 | $162,020 | $16,320 | $145,700 |
| 2014 | $2,220 | $155,120 | $16,320 | $138,800 |
Source: Public Records
Map
Nearby Homes
Your Personal Tour Guide
Ask me questions while you tour the home.