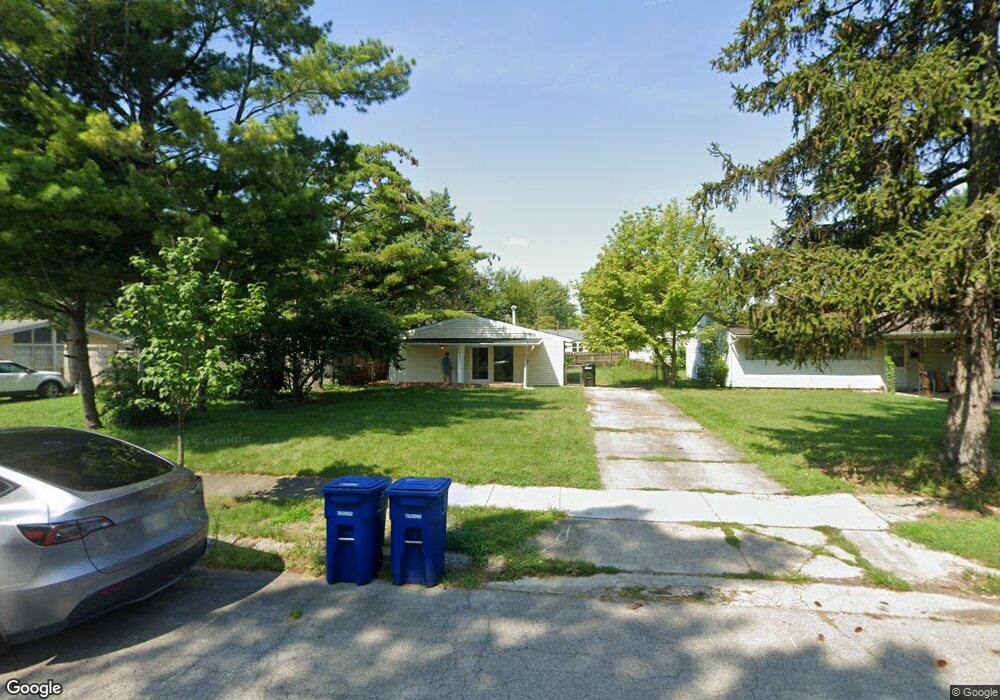
861 Mark Place Columbus, OH 43204
Southwest Hilltop NeighborhoodEstimated Value: $94,000 - $159,000
3
Beds
1
Bath
1,028
Sq Ft
$122/Sq Ft
Est. Value
About This Home
This home is located at 861 Mark Place, Columbus, OH 43204 and is currently estimated at $125,151, approximately $121 per square foot. 861 Mark Place is a home located in Franklin County with nearby schools including Binns Elementary School, Wedgewood Middle School, and Briggs High School.
Ownership History
Date
Name
Owned For
Owner Type
Purchase Details
Closed on
Sep 17, 2025
Sold by
Momentum Acquisitions Llc
Bought by
Elm Properties Llc
Current Estimated Value
Home Financials for this Owner
Home Financials are based on the most recent Mortgage that was taken out on this home.
Original Mortgage
$150,000
Outstanding Balance
$150,000
Interest Rate
6.58%
Mortgage Type
Credit Line Revolving
Estimated Equity
-$24,849
Purchase Details
Closed on
May 16, 2025
Sold by
1120-Tre Llc and 1120 Tre Llc
Bought by
Momentum Acquisitions Llc
Home Financials for this Owner
Home Financials are based on the most recent Mortgage that was taken out on this home.
Original Mortgage
$136,900
Interest Rate
6.81%
Mortgage Type
Construction
Purchase Details
Closed on
Apr 22, 2010
Sold by
Realistic Investors Llc
Bought by
1120 Tre Llc
Home Financials for this Owner
Home Financials are based on the most recent Mortgage that was taken out on this home.
Original Mortgage
$57,500
Interest Rate
5%
Mortgage Type
Commercial
Purchase Details
Closed on
Feb 12, 2008
Sold by
Suhayda Timothy Scott and Estate Of Julia Suhayda
Bought by
Realistic Investors Llc
Home Financials for this Owner
Home Financials are based on the most recent Mortgage that was taken out on this home.
Original Mortgage
$72,600
Interest Rate
5%
Mortgage Type
Commercial
Purchase Details
Closed on
Mar 31, 1987
Bought by
Suhayda Pauline E and Suhayda Julia
Purchase Details
Closed on
Jan 1, 1979
Create a Home Valuation Report for This Property
The Home Valuation Report is an in-depth analysis detailing your home's value as well as a comparison with similar homes in the area
Home Values in the Area
Average Home Value in this Area
Purchase History
| Date | Buyer | Sale Price | Title Company |
|---|---|---|---|
| Elm Properties Llc | -- | Pm Title | |
| Momentum Acquisitions Llc | $100,000 | Pm Title | |
| 1120 Tre Llc | $35,000 | Transcounty | |
| Realistic Investors Llc | $49,500 | Title First | |
| Suhayda Pauline E | $44,000 | -- | |
| -- | $24,400 | -- |
Source: Public Records
Mortgage History
| Date | Status | Borrower | Loan Amount |
|---|---|---|---|
| Open | Elm Properties Llc | $150,000 | |
| Previous Owner | Momentum Acquisitions Llc | $136,900 | |
| Previous Owner | 1120 Tre Llc | $57,500 | |
| Previous Owner | Realistic Investors Llc | $72,600 |
Source: Public Records
Tax History
| Year | Tax Paid | Tax Assessment Tax Assessment Total Assessment is a certain percentage of the fair market value that is determined by local assessors to be the total taxable value of land and additions on the property. | Land | Improvement |
|---|---|---|---|---|
| 2025 | $3,889 | $40,290 | $13,690 | $26,600 |
| 2024 | $3,889 | $40,290 | $13,690 | $26,600 |
| 2023 | $1,877 | $40,285 | $13,685 | $26,600 |
| 2022 | $7,320 | $22,090 | $6,370 | $15,720 |
| 2021 | $1,360 | $22,090 | $6,370 | $15,720 |
| 2020 | $1,276 | $22,090 | $6,370 | $15,720 |
| 2019 | $1,284 | $18,000 | $5,290 | $12,710 |
| 2018 | $1,097 | $18,000 | $5,290 | $12,710 |
| 2017 | $1,280 | $18,000 | $5,290 | $12,710 |
| 2016 | $1,337 | $17,400 | $4,270 | $13,130 |
| 2015 | $1,076 | $17,400 | $4,270 | $13,130 |
| 2014 | $1,079 | $17,400 | $4,270 | $13,130 |
| 2013 | $625 | $20,440 | $5,005 | $15,435 |
Source: Public Records
Map
Nearby Homes
- 814 Miriam Dr W
- 840 Mark Place
- 3340 Miriam Dr S
- 3318 Miriam Dr S
- 695 Demorest Rd
- 3551 Glorious Rd
- 894 Binns Blvd
- 793 Binns Blvd
- 3029 Rosedale Ave
- 988 S Roys Ave
- 570 S Westgate Ave
- 814 Chestershire Rd
- 6280 Renner Park Dr
- 3664-3670 Mccarley Dr S
- 912 Maurine Dr
- 642 S Roys Ave
- 884 S Hague Ave
- 1175-1177 Mccarley Dr S
- 903 S Harris Ave
- 2856 Vanderberg Ave Unit 858
- 869 Mark Place
- 853 Mark Place
- 877 Mark Place
- 845 Mark Place
- 862 Miriam Dr W
- 854 Miriam Dr W
- 870 Miriam Dr W
- 885 Mark Place
- 837 Mark Place
- 878 Miriam Dr W
- 846 Miriam Dr W
- 864 Mark Place
- 856 Mark Place
- 872 Mark Place
- 848 Mark Place
- 838 Miriam Dr W
- 886 Miriam Dr W
- 893 Mark Place
- 829 Mark Place
- 880 Mark Place
Your Personal Tour Guide
Ask me questions while you tour the home.