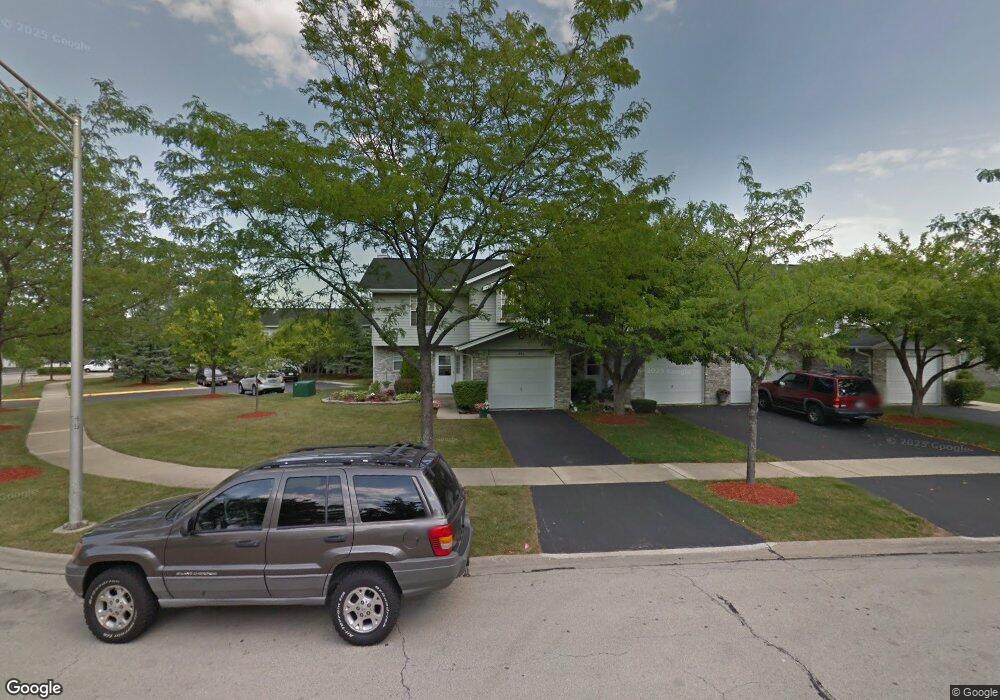
861 N Tamarac Blvd Unit X4 Addison, IL 60101
Estimated Value: $316,000 - $340,000
3
Beds
3
Baths
1,636
Sq Ft
$201/Sq Ft
Est. Value
About This Home
This home is located at 861 N Tamarac Blvd Unit X4, Addison, IL 60101 and is currently estimated at $328,186, approximately $200 per square foot. 861 N Tamarac Blvd Unit X4 is a home located in DuPage County with nearby schools including Marquardt Middle School, Glenbard East High School, and St Philip The Apostle School.
Ownership History
Date
Name
Owned For
Owner Type
Purchase Details
Closed on
Oct 19, 2016
Sold by
G10 Construction Inc & Brickstone Realty
Bought by
Nieratko Petra B
Current Estimated Value
Home Financials for this Owner
Home Financials are based on the most recent Mortgage that was taken out on this home.
Original Mortgage
$172,900
Interest Rate
3.5%
Mortgage Type
New Conventional
Purchase Details
Closed on
Apr 7, 2016
Sold by
Tinubu La Verne and New Penn Financial Llc
Bought by
G10 Construction Brickstone Realty
Purchase Details
Closed on
Aug 28, 1998
Sold by
Kukla John G and Kukla Esther A
Bought by
Tinubu Laverne
Home Financials for this Owner
Home Financials are based on the most recent Mortgage that was taken out on this home.
Original Mortgage
$113,500
Interest Rate
7.03%
Create a Home Valuation Report for This Property
The Home Valuation Report is an in-depth analysis detailing your home's value as well as a comparison with similar homes in the area
Home Values in the Area
Average Home Value in this Area
Purchase History
| Date | Buyer | Sale Price | Title Company |
|---|---|---|---|
| Nieratko Petra B | $182,000 | Chicago Title Insurance Co | |
| G10 Construction Brickstone Realty | $110,500 | None Available | |
| Tinubu Laverne | $125,500 | -- |
Source: Public Records
Mortgage History
| Date | Status | Borrower | Loan Amount |
|---|---|---|---|
| Previous Owner | Nieratko Petra B | $172,900 | |
| Previous Owner | Tinubu Laverne | $113,500 |
Source: Public Records
Tax History Compared to Growth
Tax History
| Year | Tax Paid | Tax Assessment Tax Assessment Total Assessment is a certain percentage of the fair market value that is determined by local assessors to be the total taxable value of land and additions on the property. | Land | Improvement |
|---|---|---|---|---|
| 2024 | $7,881 | $90,148 | $13,964 | $76,184 |
| 2023 | $7,365 | $82,440 | $12,770 | $69,670 |
| 2022 | $6,817 | $71,480 | $9,000 | $62,480 |
| 2021 | $6,638 | $67,910 | $8,550 | $59,360 |
| 2020 | $6,259 | $65,880 | $8,340 | $57,540 |
| 2019 | $5,993 | $63,300 | $8,010 | $55,290 |
| 2018 | $5,040 | $50,410 | $6,380 | $44,030 |
| 2017 | $4,693 | $46,140 | $5,910 | $40,230 |
| 2016 | $4,457 | $42,700 | $5,470 | $37,230 |
| 2015 | $4,344 | $39,840 | $5,100 | $34,740 |
| 2014 | $4,011 | $37,080 | $4,750 | $32,330 |
| 2013 | $4,055 | $38,350 | $4,910 | $33,440 |
Source: Public Records
Map
Nearby Homes
- 881 N Swift Rd Unit 206
- 941 N Swift Rd Unit 301
- 823 N Harrow Ct
- 818 N Rumple Ln
- 953 N Rohlwing Rd Unit GB
- 943 N Rohlwing Rd Unit 101H
- 1750 W Woodland Ave
- 22W070 Byron Ave
- 5N260 Eagle Terrace
- 1660 W Prescott Place
- 1527 W Holtz Ave
- 5N210 Central Rd
- 367 Golfview Ct
- 2 Willow Bridge Way
- 1210 N Foxdale Dr Unit 109
- 20W561 Army Trail Blvd
- 323 Morningside Dr Unit B
- 1520 W Grove St
- 316 Morningside Dr Unit A
- 580 N Highlander Way
- 861 N Tamarac Blvd Unit 861
- 863 N Tamarac Blvd
- 867 N Tamarac Blvd Unit X1
- 812 N Tamarac Blvd Unit Y1
- 814 N Tamarac Blvd
- 816 N Tamarac Blvd Unit Y3
- 871 N Tamarac Blvd Unit W5
- 818 N Tamarac Blvd Unit Y4
- 810 N Tamarac Blvd Unit Z1
- 820 N Tamarac Blvd
- 808 N Tamarac Blvd Unit Z2
- 808 N Tamarac Blvd Unit 808
- 873 N Tamarac Blvd Unit W4
- 860 N Tamarac Blvd Unit 4
- 870 N Tamarac Blvd Unit D5
- 858 N Tamarac Blvd Unit E5
- 862 N Tamarac Blvd Unit E3
- 872 N Tamarac Blvd Unit D4
- 868 N Tamarac Blvd
- 856 N Tamarac Blvd Unit E6