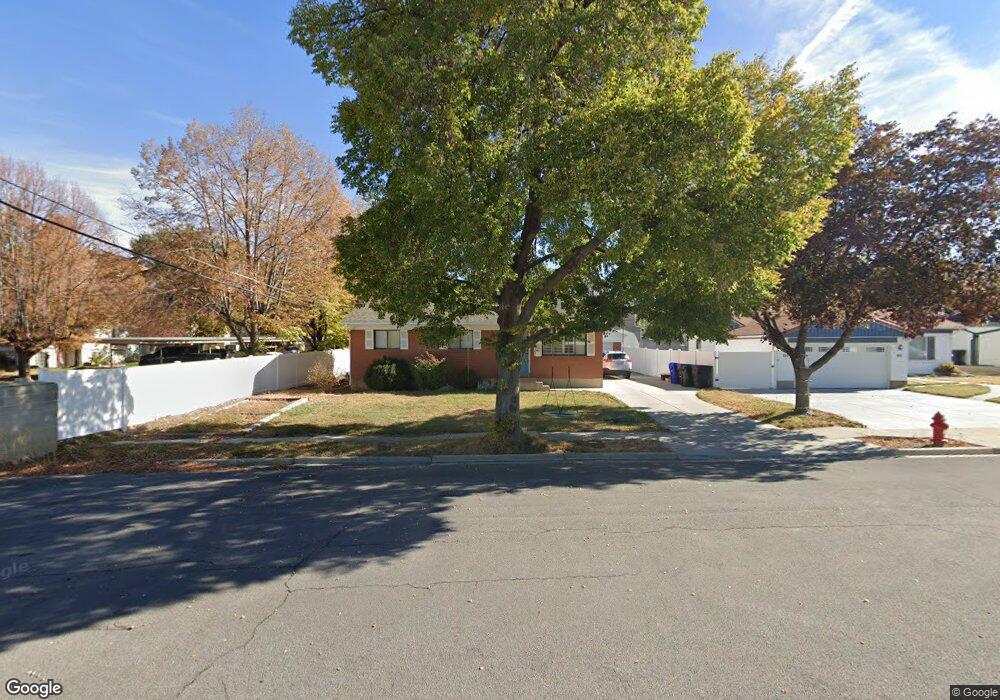
861 S 100 W Bountiful, UT 84010
Estimated Value: $481,000 - $546,000
5
Beds
2
Baths
2,080
Sq Ft
$242/Sq Ft
Est. Value
About This Home
This home is located at 861 S 100 W, Bountiful, UT 84010 and is currently estimated at $504,102, approximately $242 per square foot. 861 S 100 W is a home located in Davis County with nearby schools including Bountiful Elementary School, Millcreek Junior High School, and Bountiful High School.
Ownership History
Date
Name
Owned For
Owner Type
Purchase Details
Closed on
Dec 7, 2020
Sold by
Winegar Spencer and Winegar Julie
Bought by
Creek Derrih and Creek Whitney Kelly
Current Estimated Value
Home Financials for this Owner
Home Financials are based on the most recent Mortgage that was taken out on this home.
Original Mortgage
$404,085
Outstanding Balance
$359,578
Interest Rate
2.8%
Mortgage Type
VA
Estimated Equity
$144,524
Purchase Details
Closed on
Apr 25, 2007
Sold by
Ransom Nolan E and Ransom Patricia
Bought by
Winegar Spencer and Winegar Julie
Home Financials for this Owner
Home Financials are based on the most recent Mortgage that was taken out on this home.
Original Mortgage
$141,500
Interest Rate
6.11%
Mortgage Type
Purchase Money Mortgage
Create a Home Valuation Report for This Property
The Home Valuation Report is an in-depth analysis detailing your home's value as well as a comparison with similar homes in the area
Home Values in the Area
Average Home Value in this Area
Purchase History
| Date | Buyer | Sale Price | Title Company |
|---|---|---|---|
| Creek Derrih | -- | North Star Title Llc | |
| Winegar Spencer | -- | First American Title |
Source: Public Records
Mortgage History
| Date | Status | Borrower | Loan Amount |
|---|---|---|---|
| Open | Creek Derrih | $404,085 | |
| Previous Owner | Winegar Spencer | $141,500 |
Source: Public Records
Tax History Compared to Growth
Tax History
| Year | Tax Paid | Tax Assessment Tax Assessment Total Assessment is a certain percentage of the fair market value that is determined by local assessors to be the total taxable value of land and additions on the property. | Land | Improvement |
|---|---|---|---|---|
| 2025 | $2,877 | $264,000 | $119,363 | $144,637 |
| 2024 | $2,680 | $255,201 | $103,065 | $152,136 |
| 2023 | $2,583 | $446,000 | $192,972 | $253,028 |
| 2022 | $2,730 | $259,051 | $106,288 | $152,763 |
| 2021 | $2,490 | $361,000 | $138,956 | $222,044 |
| 2020 | $1,881 | $271,000 | $119,846 | $151,154 |
| 2019 | $1,970 | $278,000 | $134,649 | $143,351 |
| 2018 | $1,824 | $253,000 | $132,179 | $120,821 |
| 2016 | $1,514 | $113,410 | $52,919 | $60,491 |
| 2015 | $1,478 | $104,445 | $52,919 | $51,526 |
| 2014 | $1,403 | $101,728 | $52,919 | $48,809 |
| 2013 | -- | $99,995 | $39,809 | $60,186 |
Source: Public Records
Map
Nearby Homes
- 90 W 1300 S
- 650 S Main St Unit 6111
- 650 S Main St Unit 1301
- 254 W 650 S
- 1350 S 200 W
- 545 S 100 E
- 1314 S 200 W Unit 19
- 360 W 800 S
- 34 W 400 S
- 32 W 400 S
- 46 W 400 S
- 99 E 1600 S
- 288 E Peach Ln S
- 305 E Peach Ln S Unit G
- 141 E 1650 S
- 990 S 500 W
- 520 S Orchard Dr Unit 17
- 553 Clark St
- 145 S 100 E
- 285 E 1650 S