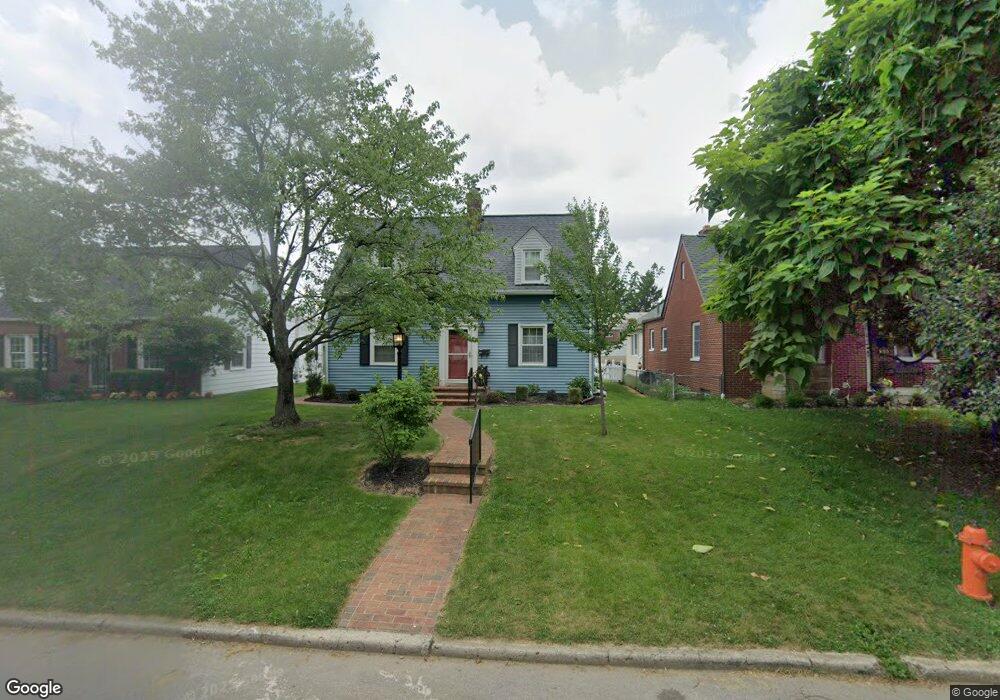
861 S Broadleigh Rd Columbus, OH 43209
Eastmoor NeighborhoodEstimated Value: $252,000 - $278,000
2
Beds
2
Baths
1,249
Sq Ft
$215/Sq Ft
Est. Value
About This Home
This home is located at 861 S Broadleigh Rd, Columbus, OH 43209 and is currently estimated at $268,928, approximately $215 per square foot. 861 S Broadleigh Rd is a home located in Franklin County with nearby schools including Fairmoor Elementary School, Johnson Park Middle School, and Walnut Ridge High School.
Ownership History
Date
Name
Owned For
Owner Type
Purchase Details
Closed on
Apr 14, 2022
Sold by
Diller Brent R and Diller Allison M
Bought by
Nehrbass Samantha Maria
Current Estimated Value
Home Financials for this Owner
Home Financials are based on the most recent Mortgage that was taken out on this home.
Original Mortgage
$190,000
Outstanding Balance
$179,816
Interest Rate
5%
Mortgage Type
New Conventional
Estimated Equity
$89,112
Purchase Details
Closed on
Sep 18, 2014
Sold by
Snyder Andrew R and Snyder Nicole L
Bought by
Diller Brent R and Diller Allison M
Home Financials for this Owner
Home Financials are based on the most recent Mortgage that was taken out on this home.
Original Mortgage
$100,700
Interest Rate
4.15%
Mortgage Type
Purchase Money Mortgage
Purchase Details
Closed on
May 20, 2010
Sold by
Held Florence S and Schuliger George S
Bought by
Snyder Andrew R and Snyder Nicole L
Home Financials for this Owner
Home Financials are based on the most recent Mortgage that was taken out on this home.
Original Mortgage
$105,266
Interest Rate
5.5%
Mortgage Type
FHA
Create a Home Valuation Report for This Property
The Home Valuation Report is an in-depth analysis detailing your home's value as well as a comparison with similar homes in the area
Home Values in the Area
Average Home Value in this Area
Purchase History
| Date | Buyer | Sale Price | Title Company |
|---|---|---|---|
| Nehrbass Samantha Maria | $237,500 | Peak Title | |
| Diller Brent R | $106,000 | Bexley Title | |
| Snyder Andrew R | $117,000 | Amerititle |
Source: Public Records
Mortgage History
| Date | Status | Borrower | Loan Amount |
|---|---|---|---|
| Open | Nehrbass Samantha Maria | $190,000 | |
| Previous Owner | Diller Brent R | $100,700 | |
| Previous Owner | Snyder Andrew R | $105,266 |
Source: Public Records
Tax History Compared to Growth
Tax History
| Year | Tax Paid | Tax Assessment Tax Assessment Total Assessment is a certain percentage of the fair market value that is determined by local assessors to be the total taxable value of land and additions on the property. | Land | Improvement |
|---|---|---|---|---|
| 2024 | $3,362 | $74,910 | $24,960 | $49,950 |
| 2023 | $3,319 | $74,900 | $24,955 | $49,945 |
| 2022 | $2,095 | $40,400 | $6,620 | $33,780 |
| 2021 | $2,099 | $40,400 | $6,620 | $33,780 |
| 2020 | $2,102 | $40,400 | $6,620 | $33,780 |
| 2019 | $2,090 | $34,450 | $5,500 | $28,950 |
| 2018 | $2,058 | $34,450 | $5,500 | $28,950 |
| 2017 | $2,163 | $34,450 | $5,500 | $28,950 |
| 2016 | $2,238 | $33,780 | $6,900 | $26,880 |
| 2015 | $2,031 | $33,780 | $6,900 | $26,880 |
| 2014 | $2,036 | $33,780 | $6,900 | $26,880 |
| 2013 | $1,004 | $33,775 | $6,895 | $26,880 |
Source: Public Records
Map
Nearby Homes
- 843 Kenwick Rd
- 789 Chelsea Ave
- 895 Grandon Ave
- 723-725 S Chesterfield Rd
- 2770 Eastminster Rd
- 2856 Eastminster Rd
- 3012 Hampshire Rd
- 696 Vernon Rd
- 891 Vernon Rd
- 905 Vernon Rd
- 782 S Remington Rd
- 2963 Brownlee Ave
- 1052 S Roosevelt Ave
- 633 Eastmoor Blvd
- 1077-1079 S James Rd
- 616 Eastmoor Blvd Unit 478
- 618 Eastmoor Blvd
- 1048 S James Rd
- 1205 Kenwick Rd
- 804 S Ashburton Rd
- 867 S Broadleigh Rd
- 853 S Broadleigh Rd
- 847 S Broadleigh Rd
- 873 S Broadleigh Rd
- 873 S Broadleigh Rd
- 841 S Broadleigh Rd
- 846 Kenwick Rd Unit 852
- 846 Kenwick Rd
- 862 Kenwick Rd
- 860 S Broadleigh Rd
- 868 Kenwick Rd
- 856 S Broadleigh Rd
- 836 Kenwick Rd
- 885 S Broadleigh Rd
- 835 S Broadleigh Rd
- 850 S Broadleigh Rd
- 878 S Broadleigh Rd
- 844 S Broadleigh Rd
- 874 Kenwick Rd
- 829 S Broadleigh Rd