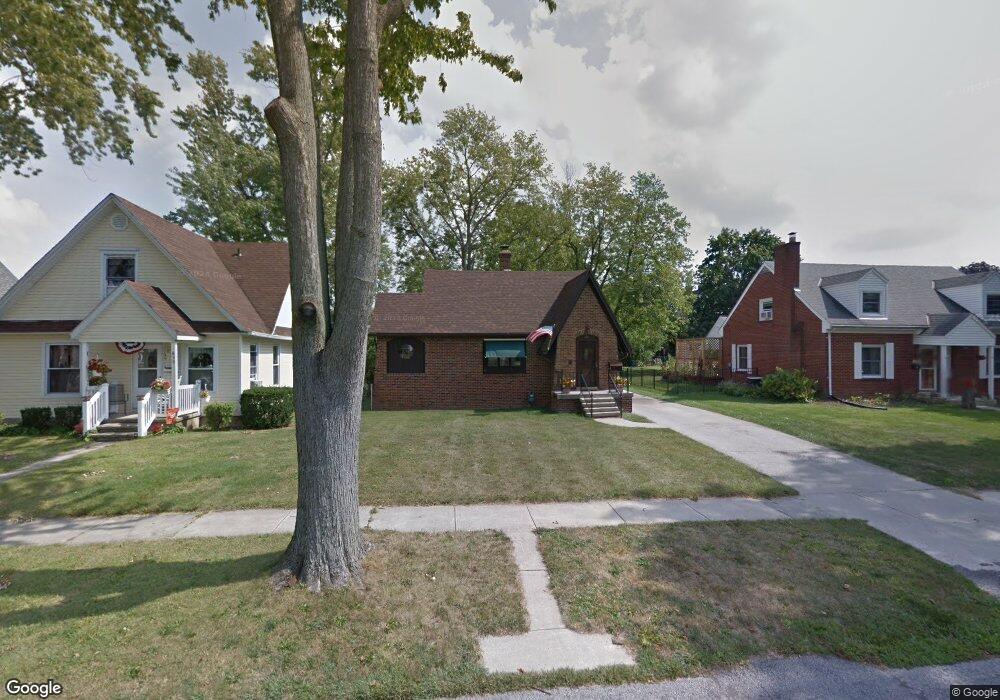
861 S Cory St Findlay, OH 45840
Estimated Value: $184,000 - $205,000
2
Beds
1
Bath
1,372
Sq Ft
$143/Sq Ft
Est. Value
About This Home
This home is located at 861 S Cory St, Findlay, OH 45840 and is currently estimated at $196,106, approximately $142 per square foot. 861 S Cory St is a home located in Hancock County with nearby schools including Lincoln Elementary School, Donnell Middle School, and Findlay High School.
Ownership History
Date
Name
Owned For
Owner Type
Purchase Details
Closed on
Feb 28, 2020
Sold by
Short Mark and Gleason Mark
Bought by
Bartley Mark
Current Estimated Value
Home Financials for this Owner
Home Financials are based on the most recent Mortgage that was taken out on this home.
Original Mortgage
$148,232
Outstanding Balance
$131,528
Interest Rate
3.6%
Mortgage Type
VA
Estimated Equity
$64,578
Purchase Details
Closed on
Feb 11, 2019
Sold by
Bishop Walter E
Bought by
Bishop Reed E and Moyer Beth Ann
Purchase Details
Closed on
Jul 10, 2012
Sold by
Estate Of Helen O Bishop
Bought by
Bishop Walter E
Create a Home Valuation Report for This Property
The Home Valuation Report is an in-depth analysis detailing your home's value as well as a comparison with similar homes in the area
Home Values in the Area
Average Home Value in this Area
Purchase History
| Date | Buyer | Sale Price | Title Company |
|---|---|---|---|
| Bartley Mark | $144,900 | None Available | |
| Bishop Reed E | -- | None Available | |
| Bishop Walter E | -- | Napa Land Title |
Source: Public Records
Mortgage History
| Date | Status | Borrower | Loan Amount |
|---|---|---|---|
| Open | Bartley Mark | $148,232 |
Source: Public Records
Tax History Compared to Growth
Tax History
| Year | Tax Paid | Tax Assessment Tax Assessment Total Assessment is a certain percentage of the fair market value that is determined by local assessors to be the total taxable value of land and additions on the property. | Land | Improvement |
|---|---|---|---|---|
| 2024 | $1,944 | $54,720 | $8,300 | $46,420 |
| 2023 | $1,947 | $54,720 | $8,300 | $46,420 |
| 2022 | $1,940 | $54,720 | $8,300 | $46,420 |
| 2021 | $1,899 | $46,660 | $8,510 | $38,150 |
| 2020 | $1,899 | $46,660 | $8,510 | $38,150 |
| 2019 | $1,910 | $46,660 | $8,510 | $38,150 |
| 2018 | $1,349 | $39,750 | $5,990 | $33,760 |
| 2017 | $1,348 | $39,750 | $5,990 | $33,760 |
| 2016 | $1,336 | $39,750 | $5,990 | $33,760 |
| 2015 | $992 | $31,440 | $5,990 | $25,450 |
| 2014 | $992 | $31,440 | $5,990 | $25,450 |
| 2012 | $1,002 | $31,440 | $5,990 | $25,450 |
Source: Public Records
Map
Nearby Homes