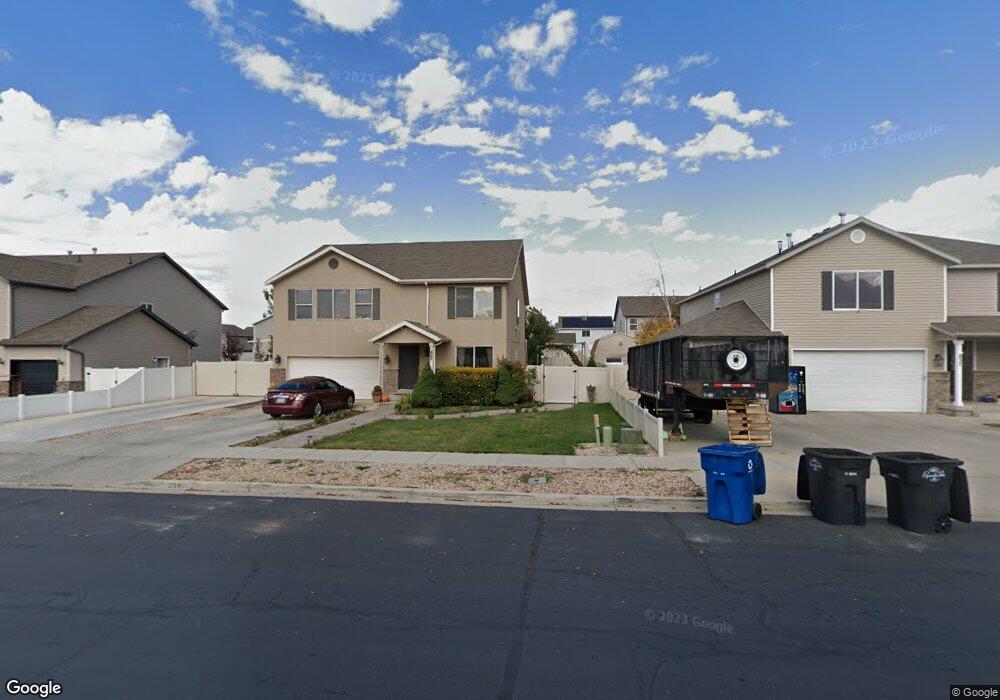
861 W 400 S Spanish Fork, UT 84660
Estimated Value: $501,000 - $549,000
4
Beds
3
Baths
2,361
Sq Ft
$221/Sq Ft
Est. Value
About This Home
This home is located at 861 W 400 S, Spanish Fork, UT 84660 and is currently estimated at $522,049, approximately $221 per square foot. 861 W 400 S is a home located in Utah County with nearby schools including Riverview Elementary School, Spanish Fork Jr High School, and Spanish Fork High School.
Ownership History
Date
Name
Owned For
Owner Type
Purchase Details
Closed on
Nov 23, 2020
Sold by
Fuhriman Bradley Jacob and Fuhriman Madeline Rose
Bought by
Calton Evan G and Calton Crystal L
Current Estimated Value
Home Financials for this Owner
Home Financials are based on the most recent Mortgage that was taken out on this home.
Original Mortgage
$328,410
Outstanding Balance
$292,238
Interest Rate
2.8%
Mortgage Type
New Conventional
Estimated Equity
$229,811
Purchase Details
Closed on
Mar 26, 2018
Sold by
Morris Robert L
Bought by
Fuhriman Bradley Jacob and Fuhriman Madeline Rose
Home Financials for this Owner
Home Financials are based on the most recent Mortgage that was taken out on this home.
Original Mortgage
$230,400
Interest Rate
4.32%
Mortgage Type
New Conventional
Create a Home Valuation Report for This Property
The Home Valuation Report is an in-depth analysis detailing your home's value as well as a comparison with similar homes in the area
Home Values in the Area
Average Home Value in this Area
Purchase History
| Date | Buyer | Sale Price | Title Company |
|---|---|---|---|
| Calton Evan G | -- | Us Title Insurance Agency | |
| Fuhriman Bradley Jacob | -- | Eagle Gate Title Ins Agency |
Source: Public Records
Mortgage History
| Date | Status | Borrower | Loan Amount |
|---|---|---|---|
| Open | Calton Evan G | $328,410 | |
| Previous Owner | Fuhriman Bradley Jacob | $230,400 |
Source: Public Records
Tax History
| Year | Tax Paid | Tax Assessment Tax Assessment Total Assessment is a certain percentage of the fair market value that is determined by local assessors to be the total taxable value of land and additions on the property. | Land | Improvement |
|---|---|---|---|---|
| 2025 | $2,309 | $255,145 | -- | -- |
| 2024 | $2,309 | $238,040 | $0 | $0 |
| 2023 | $2,384 | $246,015 | $0 | $0 |
| 2022 | $2,369 | $239,745 | $0 | $0 |
| 2021 | $2,006 | $324,800 | $101,600 | $223,200 |
| 2020 | $1,912 | $301,000 | $92,400 | $208,600 |
| 2019 | $1,706 | $282,600 | $84,300 | $198,300 |
| 2018 | $1,610 | $257,800 | $77,600 | $180,200 |
| 2017 | $1,558 | $134,035 | $0 | $0 |
| 2016 | $1,431 | $121,495 | $0 | $0 |
| 2015 | $1,324 | $111,100 | $0 | $0 |
| 2014 | $1,239 | $104,280 | $0 | $0 |
Source: Public Records
Map
Nearby Homes
- 322 Spanish Fields Dr
- 2645 W 360 S Unit 1
- 2576 W 360 S Unit 5
- 302 S 1170 W
- 1073 W River Ridge Ln
- 1076 River Hill Dr
- 764 S 1100 W
- 1018 W 40 S
- 200 W Center St
- 1701 Del Monte Rd Unit 21
- 13 N 710 W
- 1299 W 250 S
- 351 W 530 S
- 1377 W 450 S
- 243 S 1400 W
- 448 S 1400 W
- 226 N 860 W Unit 156
- 833 W 250 N
- 787 W 1120 S
- 984 S 550 W Unit 917