Estimated Value: $241,000 - $296,000
3
Beds
2
Baths
1,350
Sq Ft
$202/Sq Ft
Est. Value
About This Home
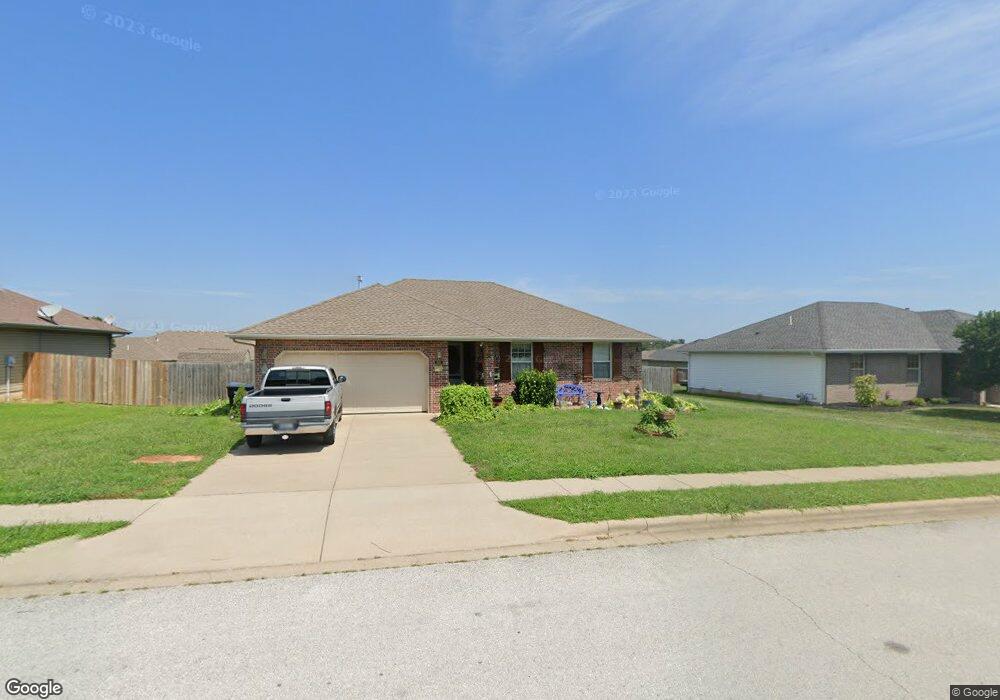
This home is located at 861 W Lorenza Dr, Nixa, MO 65714 and is currently estimated at $272,454, approximately $201 per square foot. 861 W Lorenza Dr is a home located in Christian County with nearby schools including P.S. 40 Samuel Huntington, Espy Elementary School, and Queens Gateway to Health Sciences Secondary School.
Ownership History
Date
Name
Owned For
Owner Type
Purchase Details
Closed on
Nov 22, 2017
Sold by
Morelock Ross Properties Llc
Bought by
Sr Robert Gaul and Gaul Catherine
Current Estimated Value
Home Financials for this Owner
Home Financials are based on the most recent Mortgage that was taken out on this home.
Original Mortgage
$124,242
Outstanding Balance
$104,274
Interest Rate
3.91%
Mortgage Type
New Conventional
Estimated Equity
$168,181
Purchase Details
Closed on
May 28, 2010
Sold by
Pryor Stephanie J and Edwards Clinton
Bought by
Morelock Ross Properties Inc
Home Financials for this Owner
Home Financials are based on the most recent Mortgage that was taken out on this home.
Original Mortgage
$218,700
Interest Rate
5.02%
Mortgage Type
Purchase Money Mortgage
Create a Home Valuation Report for This Property
The Home Valuation Report is an in-depth analysis detailing your home's value as well as a comparison with similar homes in the area
Home Values in the Area
Average Home Value in this Area
Purchase History
| Date | Buyer | Sale Price | Title Company |
|---|---|---|---|
| Sr Robert Gaul | -- | None Available | |
| Morelock Ross Properties Inc | -- | None Available | |
| Pryor Stephanie J | -- | None Available |
Source: Public Records
Mortgage History
| Date | Status | Borrower | Loan Amount |
|---|---|---|---|
| Open | Sr Robert Gaul | $124,242 | |
| Previous Owner | Pryor Stephanie J | $218,700 |
Source: Public Records
Tax History Compared to Growth
Tax History
| Year | Tax Paid | Tax Assessment Tax Assessment Total Assessment is a certain percentage of the fair market value that is determined by local assessors to be the total taxable value of land and additions on the property. | Land | Improvement |
|---|---|---|---|---|
| 2024 | $1,645 | $27,720 | -- | -- |
| 2023 | $1,645 | $27,720 | $0 | $0 |
| 2022 | $1,619 | $27,250 | $0 | $0 |
| 2021 | $1,620 | $27,250 | $0 | $0 |
| 2020 | $1,570 | $25,250 | $0 | $0 |
| 2019 | $1,570 | $25,250 | $0 | $0 |
| 2018 | $1,456 | $25,250 | $0 | $0 |
| 2017 | $1,456 | $25,250 | $0 | $0 |
| 2016 | $1,431 | $25,250 | $0 | $0 |
| 2015 | -- | $25,250 | $25,250 | $0 |
| 2014 | $1,403 | $25,370 | $0 | $0 |
| 2013 | $14 | $25,370 | $0 | $0 |
| 2011 | $14 | $50,740 | $0 | $0 |
Source: Public Records
Map
Nearby Homes
- 851 Meadowview Dr
- 1918 N Brookhollow Dr
- 845 Lorenza Dr
- L 5 Ph 2 Tuscany Hills
- L 14 Ph 2 Tuscany Hills
- L 7 Ph 2 Tuscany Hills
- L 6 Ph 2 Tuscany Hills
- 000 Lot 8 Tuscany Hills
- Lot 21 Ph 2 Tuscany Hills
- L 16 Ph 2 Tuscany Hills
- L 15 Ph 2 Tuscany Hills
- Lot 17 Tuscany Hills
- 813 W Regello Dr
- 1719 N Pine St
- 709 W Jackson Ave
- 1826 Cody Ave
- 000 N Gregory Dr
- 103 W Secluded Ln
- 204 W Oak St
- Lot 24 Bentwater Phase 3