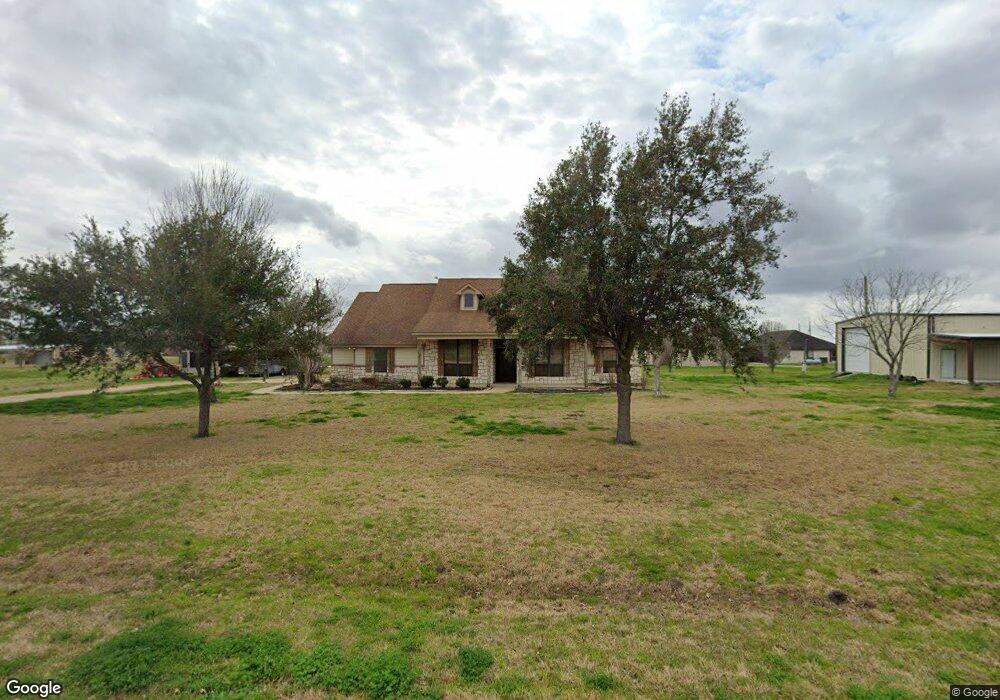
8611 Quail Park Ln Needville, TX 77461
Estimated Value: $588,507 - $818,000
4
Beds
4
Baths
3,188
Sq Ft
$204/Sq Ft
Est. Value
About This Home
This home is located at 8611 Quail Park Ln, Needville, TX 77461 and is currently estimated at $650,877, approximately $204 per square foot. 8611 Quail Park Ln is a home located in Fort Bend County with nearby schools including Needville Elementary School, Needville Junior High School, and Needville Middle School.
Ownership History
Date
Name
Owned For
Owner Type
Purchase Details
Closed on
Nov 20, 2015
Sold by
Reeves Anthony
Bought by
Hart Jeffery L
Current Estimated Value
Purchase Details
Closed on
Sep 26, 2014
Sold by
Reeves Vickie
Bought by
Reeves Anthony
Home Financials for this Owner
Home Financials are based on the most recent Mortgage that was taken out on this home.
Original Mortgage
$237,500
Interest Rate
4.21%
Purchase Details
Closed on
Jul 2, 2007
Sold by
Wood Byron Neal and Wood Stephanie
Bought by
Reeves Anthony Brent and Reeves Vickie
Home Financials for this Owner
Home Financials are based on the most recent Mortgage that was taken out on this home.
Original Mortgage
$100,000
Interest Rate
6.11%
Mortgage Type
Stand Alone Second
Purchase Details
Closed on
Jun 30, 2005
Sold by
Friedman E G
Bought by
Wood Byron Neal
Create a Home Valuation Report for This Property
The Home Valuation Report is an in-depth analysis detailing your home's value as well as a comparison with similar homes in the area
Home Values in the Area
Average Home Value in this Area
Purchase History
| Date | Buyer | Sale Price | Title Company |
|---|---|---|---|
| Hart Jeffery L | -- | -- | |
| Reeves Anthony | -- | None Available | |
| Hart Jeffery L | -- | -- | |
| Reeves Anthony Brent | -- | Universal Land Title | |
| Hart Jeffery L | -- | -- | |
| Wood Byron Neal | -- | Fidelity National Title |
Source: Public Records
Mortgage History
| Date | Status | Borrower | Loan Amount |
|---|---|---|---|
| Previous Owner | Hart Jeffery L | $237,500 | |
| Previous Owner | Hart Jeffery L | $100,000 | |
| Previous Owner | Hart Jeffery L | $237,500 |
Source: Public Records
Tax History Compared to Growth
Tax History
| Year | Tax Paid | Tax Assessment Tax Assessment Total Assessment is a certain percentage of the fair market value that is determined by local assessors to be the total taxable value of land and additions on the property. | Land | Improvement |
|---|---|---|---|---|
| 2025 | $9,919 | $611,840 | $102,703 | $509,137 |
| 2024 | $9,919 | $605,124 | $96,662 | $508,462 |
| 2023 | $8,954 | $550,113 | $79,002 | $471,111 |
| 2022 | $9,061 | $508,470 | $61,190 | $447,280 |
| 2021 | $7,478 | $394,450 | $79,000 | $315,450 |
| 2020 | $8,141 | $402,710 | $79,000 | $323,710 |
| 2019 | $7,937 | $369,680 | $38,490 | $331,190 |
| 2018 | $7,459 | $347,830 | $38,490 | $309,340 |
| 2017 | $6,929 | $322,130 | $38,490 | $283,640 |
| 2016 | $7,100 | $330,090 | $38,490 | $291,600 |
| 2015 | $5,379 | $275,910 | $38,490 | $237,420 |
| 2014 | $5,171 | $254,950 | $38,490 | $216,460 |
Source: Public Records
Map
Nearby Homes
- 7810 Church St
- 8026 Main St
- 7010 Nichols Landing
- 0 Williams School Unit 10843392
- Samuel Plan at Tejas Landing
- Leo Plan at Tejas Landing
- Arthur Plan at Tejas Landing
- Hayden Plan at Tejas Landing
- Cooperfield Plan at Tejas Landing
- Elaine Plan at Tejas Landing
- Walden Plan at Tejas Landing
- Margaret Plan at Tejas Landing
- 6918 Nichols Landing
- Millie Plan at Tejas Landing
- Josephine Plan at Tejas Landing
- 6606 Allens Landing
- 6706 Allens Landing
- 6714 Allens Landing
- 6802 Allens Landing
- 11031 Thompsons Landing
- 8623 Williams School Rd
- 8559 Williams School Rd
- 6620 Quail Park Ln
- 8635 Williams School Rd
- 8611 Williams School Rd
- 8553 Williams School Rd
- 6611 Quail Park Ln
- 6702 Quail Park Ln
- 6619 Quail Park Ln
- 6615 Williams Ct
- 8727 Williams School Rd
- 6703 Quail Park Ln
- 8723 Williams School Rd
- 6711 Quail Park Ln
- 6602 Williams Ct
- 6714 Quail Park Ln
- 6719 Quail Park Ln
- 6618 Williams Ct
- 8735 Williams School Rd
- 6702 Williams Ct