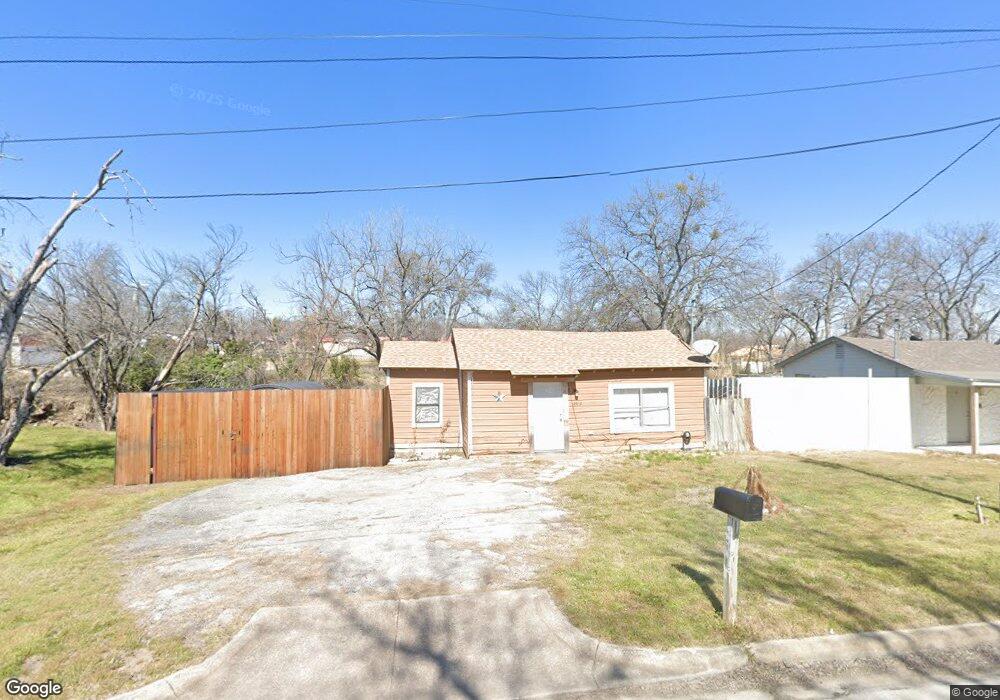
8612 Jay St Fort Worth, TX 76108
Estimated Value: $155,769 - $167,000
1
Bed
1
Bath
576
Sq Ft
$279/Sq Ft
Est. Value
About This Home
This home is located at 8612 Jay St, Fort Worth, TX 76108 and is currently estimated at $160,942, approximately $279 per square foot. 8612 Jay St is a home located in Tarrant County with nearby schools including West Elementary School, Brewer Middle School, and Tannahill Intermediate School.
Ownership History
Date
Name
Owned For
Owner Type
Purchase Details
Closed on
May 28, 2013
Sold by
Key Realty Solutions Llc
Bought by
Saldivar Emilio
Current Estimated Value
Purchase Details
Closed on
May 14, 2013
Sold by
Taylor Mary and Taylor Glen
Bought by
Key Realty Solutions Llc
Purchase Details
Closed on
Oct 2, 2000
Sold by
Livingston David and Livingston Kerensa
Bought by
Taylor Mary
Purchase Details
Closed on
Dec 1, 1993
Sold by
Stevens Conner A
Bought by
Livingston David Wayne and Livingston Kerensa Sue
Home Financials for this Owner
Home Financials are based on the most recent Mortgage that was taken out on this home.
Original Mortgage
$10,000
Interest Rate
6.71%
Mortgage Type
Seller Take Back
Purchase Details
Closed on
Jul 16, 1993
Sold by
Stevens James David and Stevens Angela Kay
Bought by
Stevens Conner A
Create a Home Valuation Report for This Property
The Home Valuation Report is an in-depth analysis detailing your home's value as well as a comparison with similar homes in the area
Home Values in the Area
Average Home Value in this Area
Purchase History
| Date | Buyer | Sale Price | Title Company |
|---|---|---|---|
| Saldivar Emilio | -- | Freedom Title | |
| Key Realty Solutions Llc | -- | Freedom Title | |
| Taylor Mary | $15,000 | -- | |
| Livingston David Wayne | -- | -- | |
| Stevens Conner A | -- | -- |
Source: Public Records
Mortgage History
| Date | Status | Borrower | Loan Amount |
|---|---|---|---|
| Previous Owner | Livingston David Wayne | $10,000 |
Source: Public Records
Tax History Compared to Growth
Tax History
| Year | Tax Paid | Tax Assessment Tax Assessment Total Assessment is a certain percentage of the fair market value that is determined by local assessors to be the total taxable value of land and additions on the property. | Land | Improvement |
|---|---|---|---|---|
| 2025 | $3,103 | $116,000 | $39,532 | $76,468 |
| 2024 | $3,103 | $130,966 | $39,532 | $91,434 |
| 2023 | $2,663 | $112,000 | $39,532 | $72,468 |
| 2022 | $2,444 | $90,248 | $18,750 | $71,498 |
| 2021 | $2,482 | $90,248 | $18,750 | $71,498 |
| 2020 | $1,330 | $48,000 | $18,750 | $29,250 |
| 2019 | $1,381 | $48,000 | $18,750 | $29,250 |
| 2018 | $1,271 | $44,187 | $9,000 | $35,187 |
| 2017 | $1,110 | $38,000 | $12,000 | $26,000 |
| 2016 | $1,008 | $34,500 | $12,000 | $22,500 |
| 2015 | $741 | $25,800 | $12,400 | $13,400 |
| 2014 | $741 | $25,800 | $12,400 | $13,400 |
Source: Public Records
Map
Nearby Homes
- 308 Hallvale Dr
- 304 Lockwood St
- 8814 Clifford St
- 8401 Clifford St
- 203 East Place
- 201 N Normandale St
- 105 Lockwood St
- 627 Hallvale Dr
- 8321 Raymond Ave
- 8814 Rockway St
- 311 Russell St
- 204 Lanham Ct
- 7945 White Settlement Rd
- 9005 Glenn Dr
- 8402 Melrose St W
- 9104 White Settlement Rd
- 9201 Clifford St
- 633 Lariat Ln
- 9200 Farmers Rd
- 9221 White Settlement Rd
- 8608 Jay St
- 8604 Jay St
- 8609 Jay St
- 418 Hallvale Dr
- 8613 Jay St
- 8701 Clifford St
- 419 Hallvale Dr
- 8605 Jay St
- 421 Lockwood St
- 414 Hallvale Dr
- 417 Hallvale Dr
- 417 Lockwood St
- 412 Hallvale Dr
- 413 Lockwood St
- 424 N Las Vegas Trail
- 415 Hallvale Dr
- 420 N Las Vegas Trail
- 8612 Ronnie St
- 409 Lockwood St
- 8608 Ronnie St