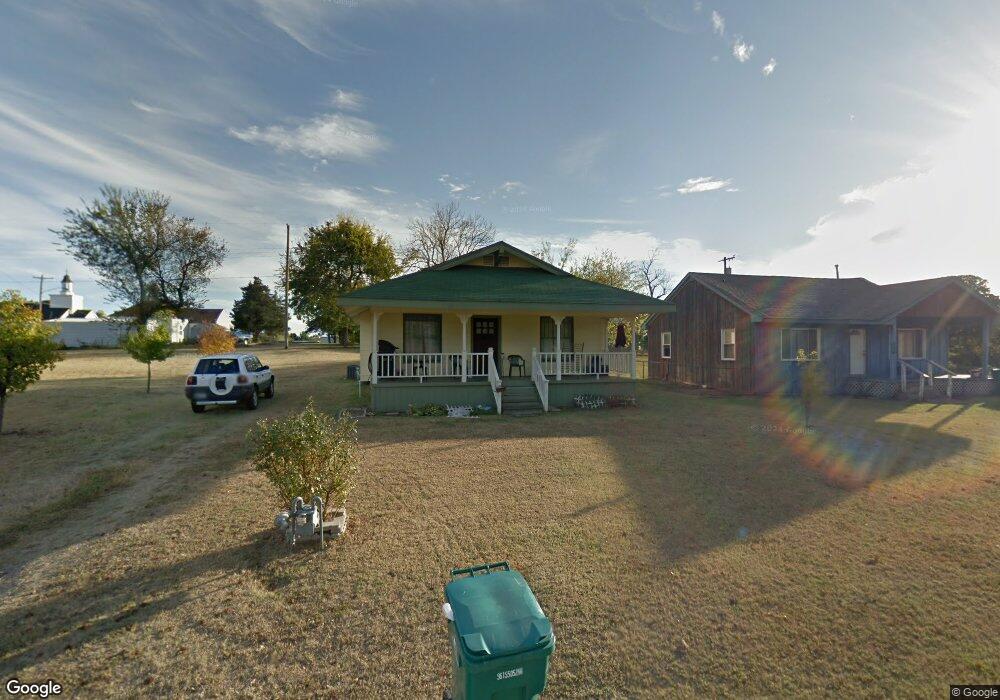
8612 NE 53rd St Spencer, OK 73084
Estimated Value: $96,000 - $126,000
2
Beds
1
Bath
952
Sq Ft
$111/Sq Ft
Est. Value
About This Home
This home is located at 8612 NE 53rd St, Spencer, OK 73084 and is currently estimated at $105,556, approximately $110 per square foot. 8612 NE 53rd St is a home located in Oklahoma County with nearby schools including Willow Brook Elementary School and Star Spencer Mid-High School.
Ownership History
Date
Name
Owned For
Owner Type
Purchase Details
Closed on
Jun 29, 2023
Sold by
Richardson Tony and Richardson Marilyn
Bought by
Rudolph Janee
Current Estimated Value
Home Financials for this Owner
Home Financials are based on the most recent Mortgage that was taken out on this home.
Original Mortgage
$61,666
Outstanding Balance
$60,082
Interest Rate
6.39%
Mortgage Type
New Conventional
Estimated Equity
$45,474
Purchase Details
Closed on
Mar 8, 2002
Sold by
Citifinancial Mtg Company Inc
Bought by
Richardson Tony
Purchase Details
Closed on
Nov 19, 2001
Sold by
Weir Phyllis E and Weir Darrell W
Bought by
Associates Home Equity Services Inc
Purchase Details
Closed on
Apr 7, 2000
Sold by
Holland Terry
Bought by
Weir Phyllis E
Home Financials for this Owner
Home Financials are based on the most recent Mortgage that was taken out on this home.
Original Mortgage
$41,054
Interest Rate
8.27%
Create a Home Valuation Report for This Property
The Home Valuation Report is an in-depth analysis detailing your home's value as well as a comparison with similar homes in the area
Home Values in the Area
Average Home Value in this Area
Purchase History
| Date | Buyer | Sale Price | Title Company |
|---|---|---|---|
| Rudolph Janee | $55,500 | Chicago Title | |
| Richardson Tony | $29,000 | American Guaranty Title Co | |
| Associates Home Equity Services Inc | -- | -- | |
| Weir Phyllis E | $41,000 | Lawyers Title |
Source: Public Records
Mortgage History
| Date | Status | Borrower | Loan Amount |
|---|---|---|---|
| Open | Rudolph Janee | $61,666 | |
| Previous Owner | Weir Phyllis E | $41,054 |
Source: Public Records
Tax History Compared to Growth
Tax History
| Year | Tax Paid | Tax Assessment Tax Assessment Total Assessment is a certain percentage of the fair market value that is determined by local assessors to be the total taxable value of land and additions on the property. | Land | Improvement |
|---|---|---|---|---|
| 2024 | $532 | $8,360 | $396 | $7,964 |
| 2023 | $532 | $4,922 | $250 | $4,672 |
| 2022 | $479 | $4,687 | $284 | $4,403 |
| 2021 | $460 | $4,464 | $309 | $4,155 |
| 2020 | $442 | $4,252 | $329 | $3,923 |
| 2019 | $420 | $4,050 | $327 | $3,723 |
| 2018 | $378 | $3,857 | $0 | $0 |
| 2017 | $360 | $3,672 | $180 | $3,492 |
| 2016 | $345 | $3,498 | $179 | $3,319 |
| 2015 | $329 | $3,332 | $211 | $3,121 |
| 2014 | $341 | $3,464 | $220 | $3,244 |
Source: Public Records
Map
Nearby Homes
- 8509 NE 51st Main St
- 0 NE 52nd St
- 0 NE 47th St
- 8817 NE 46th St
- 8726 Silver Creek Dr
- 9208 NE 50th St
- 0 NE 45th St
- 4102 Cramer Rd
- 4709 Baker St
- 4912 Chester St
- 10718 NE 46th St
- 0 Kramer Rd
- 0 NE 39th St Unit 1205405
- 11827 NE 50th St
- 9916 NE 36th St
- 8506 NE 34th Place
- 8502 NE 34th Place
- 0 0
- 4904 Sunset Terrace
- 7201 N Douglas Blvd
- 8608 NE 53rd St
- 8617 NE 52nd St
- 8619 NE 53rd St
- 8609 NE 52nd St
- 8601 NE 53rd St
- 8601 NE 52nd St
- 5320 Spencer Rd
- 5315 Indiana Ave
- 8709 NE 52nd St
- 8507 NE 52nd St
- 5417 Palmer Ave
- 5221 Indiana Ave
- 5401 Spencer Rd
- 8715 NE 52nd St
- 8714 NE 53rd St
- 8417 Main St
- 0 NE 53rd St
- 8716 NE 52nd St
- 000 NE 52nd St
- 12212 NE 52nd St