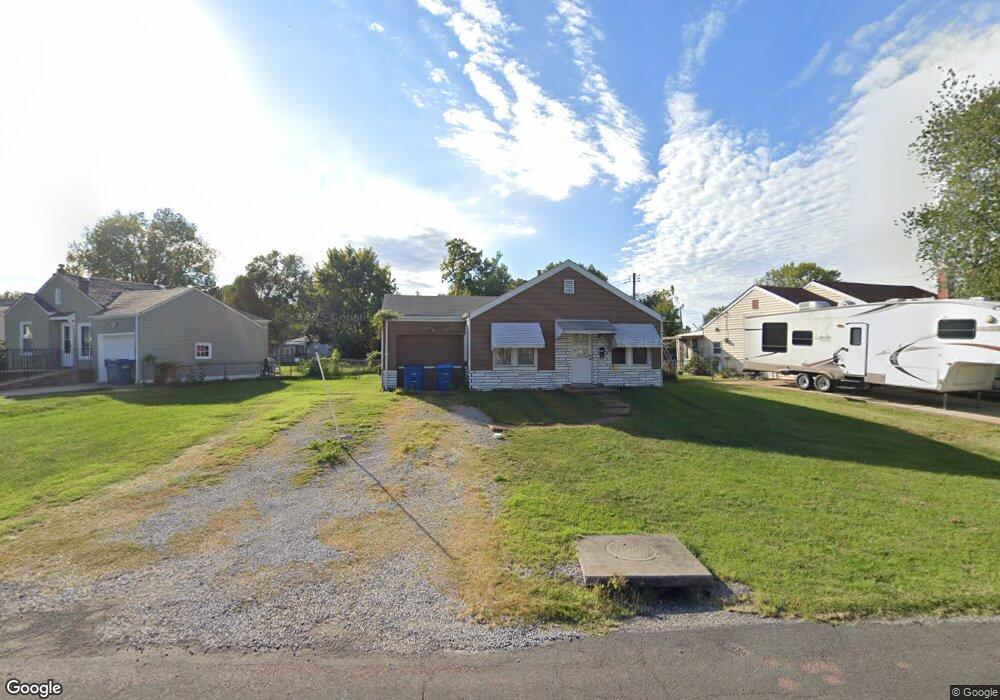
8613 Shoss Ave Saint Louis, MO 63125
Lemay NeighborhoodEstimated Value: $54,000 - $158,000
2
Beds
1
Bath
790
Sq Ft
$130/Sq Ft
Est. Value
About This Home
This home is located at 8613 Shoss Ave, Saint Louis, MO 63125 and is currently estimated at $102,902, approximately $130 per square foot. 8613 Shoss Ave is a home located in St. Louis County with nearby schools including Hancock Place Elementary School, Hancock Place Middle School, and Hancock Place High School.
Ownership History
Date
Name
Owned For
Owner Type
Purchase Details
Closed on
Jun 23, 2016
Sold by
Mahmutovic Selver and Mahmutovic Fadila
Bought by
Mahmutovic Corp
Current Estimated Value
Purchase Details
Closed on
Oct 16, 2015
Sold by
Mahmutovic Selver and Mahmutovic Fadila
Bought by
Mahmutovic Selver and Mahmutovic Fadila
Purchase Details
Closed on
Feb 25, 2013
Sold by
Secretary Of Housing & Urban Development
Bought by
Mahmutovic Selver
Purchase Details
Closed on
May 15, 2012
Sold by
Brookisher William Y and Williams Freda J
Bought by
Bank Of America Na
Purchase Details
Closed on
May 4, 2012
Sold by
Bank Of America Na
Bought by
Secretary Of Housing & Urban Development
Purchase Details
Closed on
Oct 31, 2003
Sold by
Oglesby Mark S and Oglesby Jennifer
Bought by
Brookisher William Y and Williams Freda J
Home Financials for this Owner
Home Financials are based on the most recent Mortgage that was taken out on this home.
Original Mortgage
$76,794
Interest Rate
5.81%
Mortgage Type
FHA
Create a Home Valuation Report for This Property
The Home Valuation Report is an in-depth analysis detailing your home's value as well as a comparison with similar homes in the area
Home Values in the Area
Average Home Value in this Area
Purchase History
| Date | Buyer | Sale Price | Title Company |
|---|---|---|---|
| Mahmutovic Corp | -- | None Available | |
| Mahmutovic Selver | -- | None Available | |
| Mahmutovic Selver | $16,100 | None Available | |
| Bank Of America Na | $75,496 | None Available | |
| Secretary Of Housing & Urban Development | $68,560 | None Available | |
| Brookisher William Y | $78,000 | -- |
Source: Public Records
Mortgage History
| Date | Status | Borrower | Loan Amount |
|---|---|---|---|
| Previous Owner | Brookisher William Y | $76,794 |
Source: Public Records
Tax History Compared to Growth
Tax History
| Year | Tax Paid | Tax Assessment Tax Assessment Total Assessment is a certain percentage of the fair market value that is determined by local assessors to be the total taxable value of land and additions on the property. | Land | Improvement |
|---|---|---|---|---|
| 2025 | $973 | $27,590 | $13,170 | $14,420 |
| 2024 | $973 | $12,350 | $5,260 | $7,090 |
| 2023 | $925 | $12,350 | $5,260 | $7,090 |
| 2022 | $1,017 | $12,350 | $6,080 | $6,270 |
| 2021 | $1,000 | $18,750 | $6,080 | $12,670 |
| 2020 | $1,417 | $16,870 | $5,890 | $10,980 |
| 2019 | $1,413 | $16,870 | $5,890 | $10,980 |
| 2018 | $1,303 | $13,550 | $4,560 | $8,990 |
| 2017 | $1,281 | $13,550 | $4,560 | $8,990 |
| 2016 | $777 | $7,810 | $2,090 | $5,720 |
| 2015 | $773 | $7,810 | $2,090 | $5,720 |
| 2014 | $924 | $9,980 | $4,410 | $5,570 |
Source: Public Records
Map
Nearby Homes
- 8626 Shoss Ave
- 8523 Idaho Ave
- 8439 Tennessee Ave
- 252 Wachtel Ave
- 241 Dammert Ave
- 235 Military Rd
- 622 Kayser Ave
- 610 Kayser Ave
- 300 Kayser Ave
- 302 Waller Ave
- 3708 Comstock Dr
- 711 Erskine Ave
- 514 E Dallas Ct
- 715 Erskine Ave
- 712 Pardella Ave
- 3720 Comstock Dr
- 335 Horn Ave
- 720 Erskine Ave
- 324 Hurck St
- 212 Espenschied St
- 8633 Shoss Ave
- 8609 Shoss Ave
- 8637 Shoss Ave
- 8605 Shoss Ave
- 8640 S Grand Ave
- 8644 S Grand Ave
- 8641 Shoss Ave
- 8622 Shoss Ave
- 8648 S Grand Ave
- 8618 Shoss Ave
- 8601 Shoss Ave
- 8630 Shoss Ave
- 8634 Shoss Ave
- 8652 S Grand Ave
- 8638 Shoss Ave
- 8610 Shoss Ave
- 8642 Shoss Ave
- 8606 Shoss Ave
- 8600 Shoss Ave
- 318 Little Broadway St