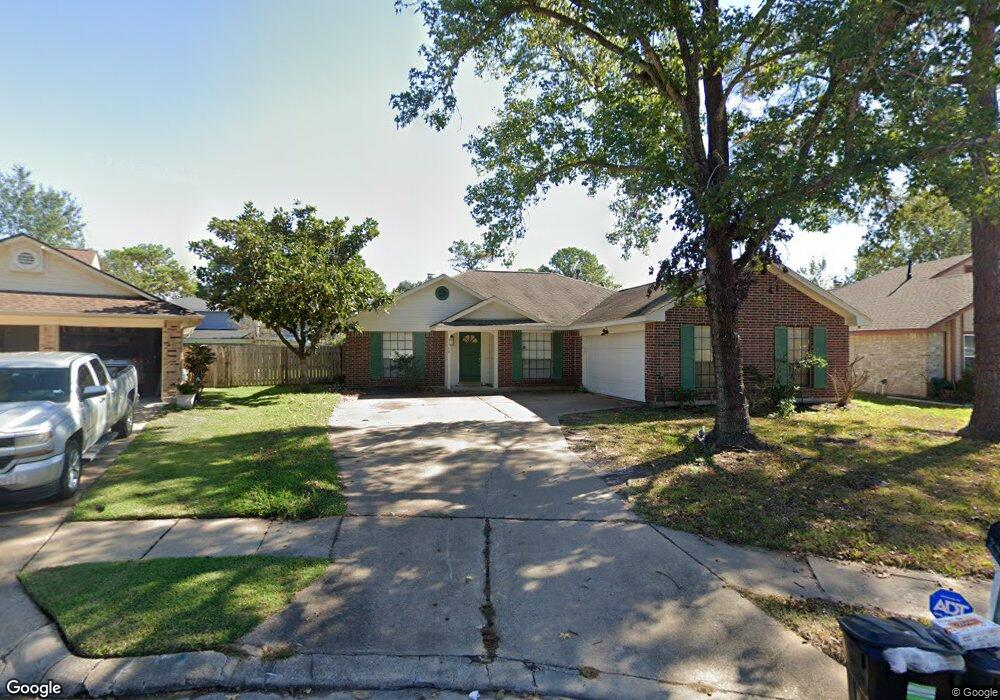
8614 Greenleaf Lake Dr Houston, TX 77095
Estimated Value: $244,908 - $279,000
3
Beds
2
Baths
1,710
Sq Ft
$155/Sq Ft
Est. Value
About This Home
This home is located at 8614 Greenleaf Lake Dr, Houston, TX 77095 and is currently estimated at $265,227, approximately $155 per square foot. 8614 Greenleaf Lake Dr is a home located in Harris County with nearby schools including Fiest Elementary School, Labay Middle School, and Cypress Falls High School.
Ownership History
Date
Name
Owned For
Owner Type
Purchase Details
Closed on
Jan 26, 2019
Sold by
Grass David and Grass Janice
Bought by
Elm Street Assets Llc 8614 Greenleaf Ser
Current Estimated Value
Home Financials for this Owner
Home Financials are based on the most recent Mortgage that was taken out on this home.
Original Mortgage
$128,223
Outstanding Balance
$112,958
Interest Rate
4.6%
Mortgage Type
New Conventional
Estimated Equity
$152,269
Purchase Details
Closed on
Feb 20, 2003
Sold by
Rhodes Joel Brett and Rhodes Grace Bendicion
Bought by
Grass David B and Grass Janice
Home Financials for this Owner
Home Financials are based on the most recent Mortgage that was taken out on this home.
Original Mortgage
$92,800
Interest Rate
5.9%
Create a Home Valuation Report for This Property
The Home Valuation Report is an in-depth analysis detailing your home's value as well as a comparison with similar homes in the area
Home Values in the Area
Average Home Value in this Area
Purchase History
| Date | Buyer | Sale Price | Title Company |
|---|---|---|---|
| Elm Street Assets Llc 8614 Greenleaf Ser | -- | None Available | |
| Grass David B | -- | -- |
Source: Public Records
Mortgage History
| Date | Status | Borrower | Loan Amount |
|---|---|---|---|
| Open | Elm Street Assets Llc 8614 Greenleaf Ser | $128,223 | |
| Previous Owner | Grass David B | $92,800 |
Source: Public Records
Tax History Compared to Growth
Tax History
| Year | Tax Paid | Tax Assessment Tax Assessment Total Assessment is a certain percentage of the fair market value that is determined by local assessors to be the total taxable value of land and additions on the property. | Land | Improvement |
|---|---|---|---|---|
| 2025 | $4,333 | $234,720 | $71,053 | $163,667 |
| 2024 | $4,333 | $212,393 | $61,785 | $150,608 |
| 2023 | $4,333 | $237,343 | $61,785 | $175,558 |
| 2022 | $4,685 | $212,589 | $49,428 | $163,161 |
| 2021 | $4,188 | $180,395 | $49,428 | $130,967 |
| 2020 | $3,832 | $160,675 | $41,190 | $119,485 |
| 2019 | $4,205 | $170,388 | $34,325 | $136,063 |
| 2018 | $2,228 | $154,733 | $34,325 | $120,408 |
| 2017 | $3,211 | $140,000 | $34,325 | $105,675 |
| 2016 | $3,334 | $145,357 | $34,325 | $111,032 |
| 2015 | $3,028 | $129,300 | $34,325 | $94,975 |
| 2014 | $3,028 | $130,178 | $26,774 | $103,404 |
Source: Public Records
Map
Nearby Homes
- 8526 Greenleaf Lake Dr
- 15735 Jamie Lee Dr
- 15634 Haleys Landing Ln
- 15610 Tarpon Springs Ct
- 15610 Manorford Ct
- 15627 Kentwater Ct
- 15802 Aberdeen Trails Dr
- 8818 Apple Mill Dr
- 15611 Meadow Village Dr
- 9303 Reston Grove Ln
- 15414 Swan Creek Dr
- 15954 Oak Mountain Dr
- 9111 Sunny Ridge Dr
- 15415 Swan Creek Dr
- 8306 Lake Crystal Dr
- 15906 Marwick Ct
- 8550 Sparkling Springs Dr
- 9138 Shango Ln
- 8526 Hot Springs Dr
- 15362 Meadow Village Dr
- 8610 Greenleaf Lake Dr
- 8618 Greenleaf Lake Dr
- 8615 Lake Crystal Dr
- 8623 Lake Crystal Dr
- 8611 Lake Crystal Dr
- 8606 Greenleaf Lake Dr
- 8622 Greenleaf Lake Dr
- 8627 Lake Crystal Dr
- 8607 Lake Crystal Dr
- 8615 Greenleaf Lake Dr
- 8607 Greenleaf Lake Dr
- 8623 Greenleaf Lake Dr
- 8602 Greenleaf Lake Dr
- 8631 Lake Crystal Dr
- 8603 Lake Crystal Dr
- 8619 Greenleaf Lake Dr
- 8603 Greenleaf Lake Dr
- 8539 Lake Crystal Dr
- 15727 Oak Mountain Dr
- 15731 Oak Mountain Dr