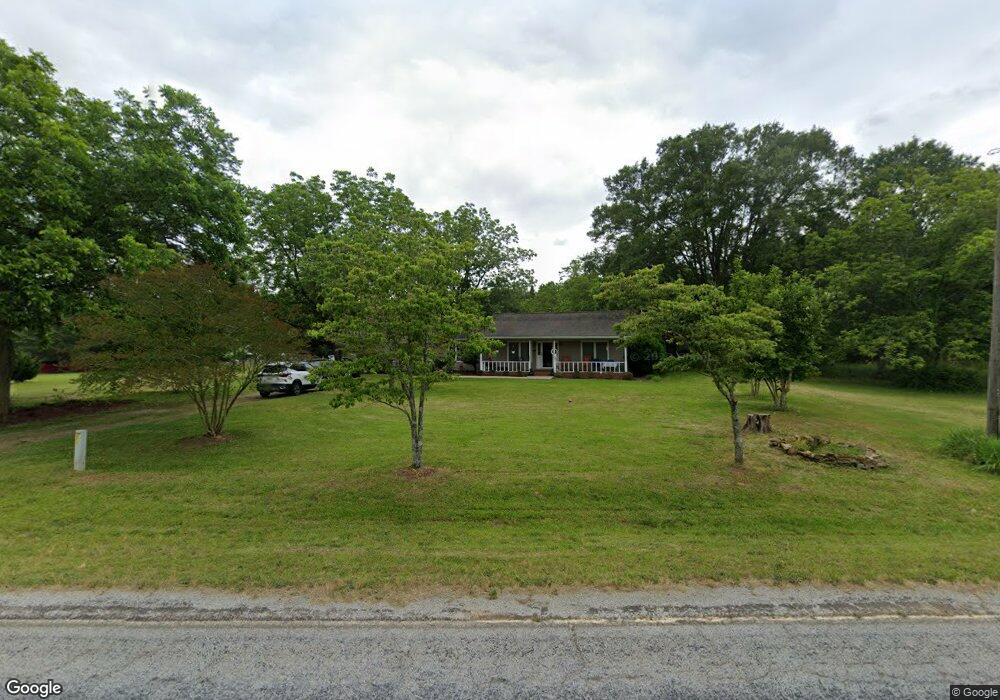
8614 Reed Creek Hwy Hartwell, GA 30643
Estimated Value: $340,000 - $396,000
--
Bed
2
Baths
2,221
Sq Ft
$167/Sq Ft
Est. Value
About This Home
This home is located at 8614 Reed Creek Hwy, Hartwell, GA 30643 and is currently estimated at $370,270, approximately $166 per square foot. 8614 Reed Creek Hwy is a home located in Hart County with nearby schools including Hart County High School.
Ownership History
Date
Name
Owned For
Owner Type
Purchase Details
Closed on
Jun 23, 2022
Sold by
Nicholas David Michael
Bought by
Flantzer Mary G
Current Estimated Value
Purchase Details
Closed on
Sep 22, 2021
Sold by
Pierce Kimberly H
Bought by
Strickland Bryson T and Jones Margarita R
Home Financials for this Owner
Home Financials are based on the most recent Mortgage that was taken out on this home.
Original Mortgage
$303,525
Interest Rate
2.8%
Mortgage Type
New Conventional
Purchase Details
Closed on
May 14, 2021
Sold by
Pierce Kimberly H
Bought by
Nichols David Michael and Nichols Mary Tara
Purchase Details
Closed on
Sep 6, 2019
Sold by
Orbea Leonel
Bought by
Pierce Kimberly H
Purchase Details
Closed on
Jul 20, 2009
Sold by
Wright Stephen M
Bought by
Orbea Leonel
Purchase Details
Closed on
Jun 1, 2004
Purchase Details
Closed on
Feb 1, 1995
Purchase Details
Closed on
May 1, 1966
Create a Home Valuation Report for This Property
The Home Valuation Report is an in-depth analysis detailing your home's value as well as a comparison with similar homes in the area
Home Values in the Area
Average Home Value in this Area
Purchase History
| Date | Buyer | Sale Price | Title Company |
|---|---|---|---|
| Flantzer Mary G | $331,000 | -- | |
| Strickland Bryson T | $319,500 | -- | |
| Nichols David Michael | $326,000 | -- | |
| Pierce Kimberly H | $3,000 | -- | |
| Orbea Leonel | -- | -- | |
| -- | $20,000 | -- | |
| -- | -- | -- | |
| -- | -- | -- |
Source: Public Records
Mortgage History
| Date | Status | Borrower | Loan Amount |
|---|---|---|---|
| Previous Owner | Strickland Bryson T | $303,525 |
Source: Public Records
Tax History Compared to Growth
Tax History
| Year | Tax Paid | Tax Assessment Tax Assessment Total Assessment is a certain percentage of the fair market value that is determined by local assessors to be the total taxable value of land and additions on the property. | Land | Improvement |
|---|---|---|---|---|
| 2024 | $3,451 | $142,890 | $10,000 | $132,890 |
| 2023 | $3,396 | $131,050 | $10,000 | $121,050 |
| 2022 | $1,705 | $102,386 | $9,600 | $92,786 |
| 2021 | $1,697 | $91,481 | $8,400 | $83,081 |
| 2020 | $23 | $8,400 | $8,400 | $0 |
| 2019 | $164 | $8,400 | $8,400 | $0 |
| 2018 | $87 | $4,400 | $4,400 | $0 |
| 2017 | $87 | $4,400 | $4,400 | $0 |
| 2016 | $221 | $10,774 | $4,400 | $6,374 |
| 2015 | $215 | $11,056 | $4,400 | $6,656 |
| 2014 | $288 | $14,508 | $7,920 | $6,588 |
| 2013 | -- | $17,924 | $7,920 | $10,004 |
Source: Public Records
Map
Nearby Homes
- 454 Harbor Point
- 395 Tom Cobb Dr
- 385 Tom Cobb Dr
- 1 Pristine Cove
- 5 Pristine Cove
- 0 LOT 3 Reed Creek Point
- 1311 Hatton Ford Rd
- 31 Moreland Heights Ct
- 158 Creekwood Rd
- 99 Crane Creek Dr
- 242 Pristine Cove
- 120 Breezy Point
- 1696 Crawfords Ferry Rd
- 0 Crawfords Ferry Point Unit 10450888
- 590 Rainbow Dr
- TRACT A Wineberger Rd
- 20 Osceola Trail
- 149 Foxtail Dr
- 213 Perry Cir
- 10 Osceola Trail
- 8614 Reed Creek Hwy
- 8680 Reed Creek Hwy
- 78 Harbor Point
- 4 Harbor Point N
- 134 Harbor Point Dr
- 120 Hatton Ford Rd
- 134 C Harbor Point
- 134 B Harbor Point
- N Harbor Point
- LOT 6 Harbor Point
- 3 Harbor Point Unit 1
- Lot 5 Harbor Point
- Lot 1 Harbor Point
- Lot 2 Harbor Point
- 7 Harbor Point
- 7 Harbor Point Unit 7
- 6 Harbor Point
- 5 Harbor Point
- 4 Harbor Point
- 3 Harbor Point