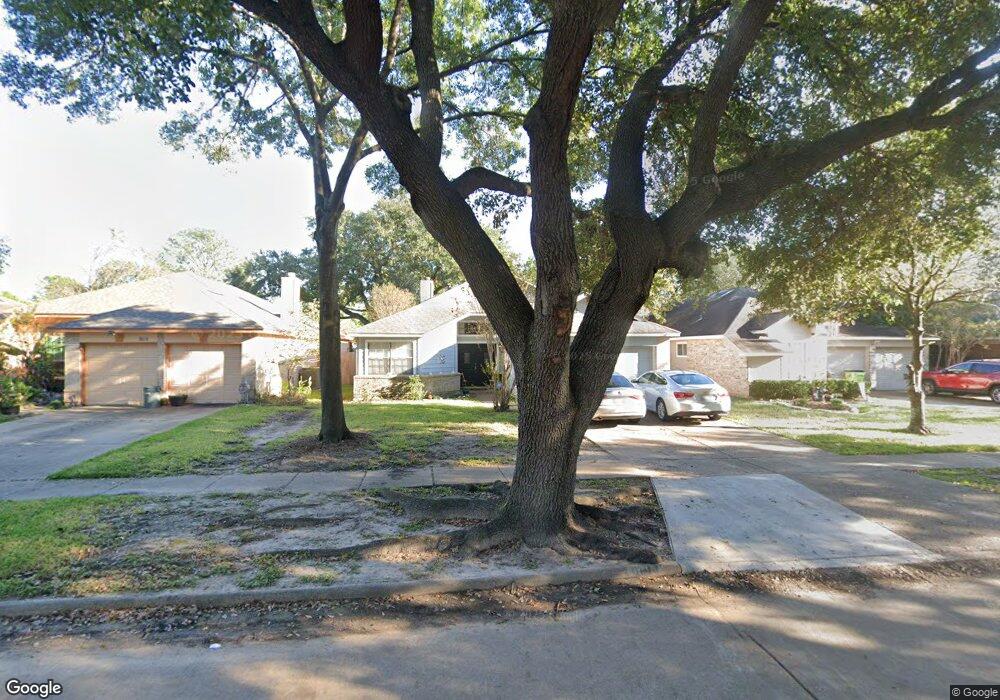
8614 Sparkling Springs Dr Houston, TX 77095
Copperfield NeighborhoodEstimated Value: $259,020 - $286,000
3
Beds
2
Baths
1,871
Sq Ft
$148/Sq Ft
Est. Value
About This Home
This home is located at 8614 Sparkling Springs Dr, Houston, TX 77095 and is currently estimated at $276,755, approximately $147 per square foot. 8614 Sparkling Springs Dr is a home located in Harris County with nearby schools including Fiest Elementary School, Labay Middle School, and Cypress Falls High School.
Ownership History
Date
Name
Owned For
Owner Type
Purchase Details
Closed on
Sep 15, 2011
Sold by
Sparkling Springs Llc
Bought by
Wise Salante Dantez
Current Estimated Value
Home Financials for this Owner
Home Financials are based on the most recent Mortgage that was taken out on this home.
Original Mortgage
$93,565
Outstanding Balance
$64,591
Interest Rate
4.43%
Mortgage Type
FHA
Estimated Equity
$212,164
Purchase Details
Closed on
Mar 21, 2005
Sold by
Gary Thomas Edward and Gary Lynette Dawn
Bought by
Sparkling Springs Llc
Purchase Details
Closed on
Jan 14, 1999
Sold by
Ortiz Alfredo and Ortiz Lorena M
Bought by
Gary Thomas Edward and Gary Lynette Dawn
Home Financials for this Owner
Home Financials are based on the most recent Mortgage that was taken out on this home.
Original Mortgage
$63,900
Interest Rate
6.68%
Create a Home Valuation Report for This Property
The Home Valuation Report is an in-depth analysis detailing your home's value as well as a comparison with similar homes in the area
Home Values in the Area
Average Home Value in this Area
Purchase History
| Date | Buyer | Sale Price | Title Company |
|---|---|---|---|
| Wise Salante Dantez | -- | First American Title | |
| Sparkling Springs Llc | -- | -- | |
| Gary Thomas Edward | -- | Commonwealth Land Title Co |
Source: Public Records
Mortgage History
| Date | Status | Borrower | Loan Amount |
|---|---|---|---|
| Open | Wise Salante Dantez | $93,565 | |
| Previous Owner | Gary Thomas Edward | $63,900 |
Source: Public Records
Tax History Compared to Growth
Tax History
| Year | Tax Paid | Tax Assessment Tax Assessment Total Assessment is a certain percentage of the fair market value that is determined by local assessors to be the total taxable value of land and additions on the property. | Land | Improvement |
|---|---|---|---|---|
| 2025 | $3,098 | $259,362 | $57,503 | $201,859 |
| 2024 | $3,098 | $257,374 | $48,032 | $209,342 |
| 2023 | $3,098 | $254,663 | $48,032 | $206,631 |
| 2022 | $4,514 | $228,038 | $34,276 | $193,762 |
| 2021 | $4,324 | $186,240 | $34,276 | $151,964 |
| 2020 | $4,182 | $176,438 | $28,639 | $147,799 |
| 2019 | $3,934 | $166,611 | $28,639 | $137,972 |
| 2018 | $1,309 | $144,912 | $28,639 | $116,273 |
| 2017 | $3,324 | $144,912 | $28,639 | $116,273 |
| 2016 | $3,206 | $144,912 | $28,639 | $116,273 |
| 2015 | $2,071 | $144,912 | $28,639 | $116,273 |
| 2014 | $2,071 | $122,557 | $22,099 | $100,458 |
Source: Public Records
Map
Nearby Homes
- 8550 Sparkling Springs Dr
- 15954 Oak Mountain Dr
- 8306 Lake Crystal Dr
- 8426 Laurel Trails Dr
- 8526 Hot Springs Dr
- 16111 Aberdeen Forest Dr
- 8550 Waiting Spring Ln
- 16123 Aberdeen Forest Dr
- 8814 Sherina Park Dr
- 8526 Greenleaf Lake Dr
- 15735 Jamie Lee Dr
- 16211 Green Smoke Dr
- 15918 Pinyon Creek Dr
- 15906 Marwick Ct
- 16403 Torry View Terrace
- 15802 Aberdeen Trails Dr
- 16335 Drystone Ln
- 8835 Aberdeen Park Dr
- 8806 Gas Light Village Dr
- 8619 Arranmore Ln
- 8610 Sparkling Springs Dr
- 8618 Sparkling Springs Dr
- 8606 Sparkling Springs Dr
- 8622 Sparkling Springs Dr
- 8611 Spring Green Dr
- 8615 Spring Green Dr
- 8607 Spring Green Dr
- 8619 Spring Green Dr
- 8602 Sparkling Springs Dr
- 8626 Sparkling Springs Dr
- 8603 Spring Green Dr
- 8623 Spring Green Dr
- 8554 Sparkling Springs Dr
- 8615 Sparkling Springs Dr
- 8630 Sparkling Springs Dr
- 8611 Sparkling Springs Dr
- 8571 Spring Green Dr
- 8627 Spring Green Dr
- 8607 Sparkling Springs Dr
- 8623 Sparkling Springs Dr