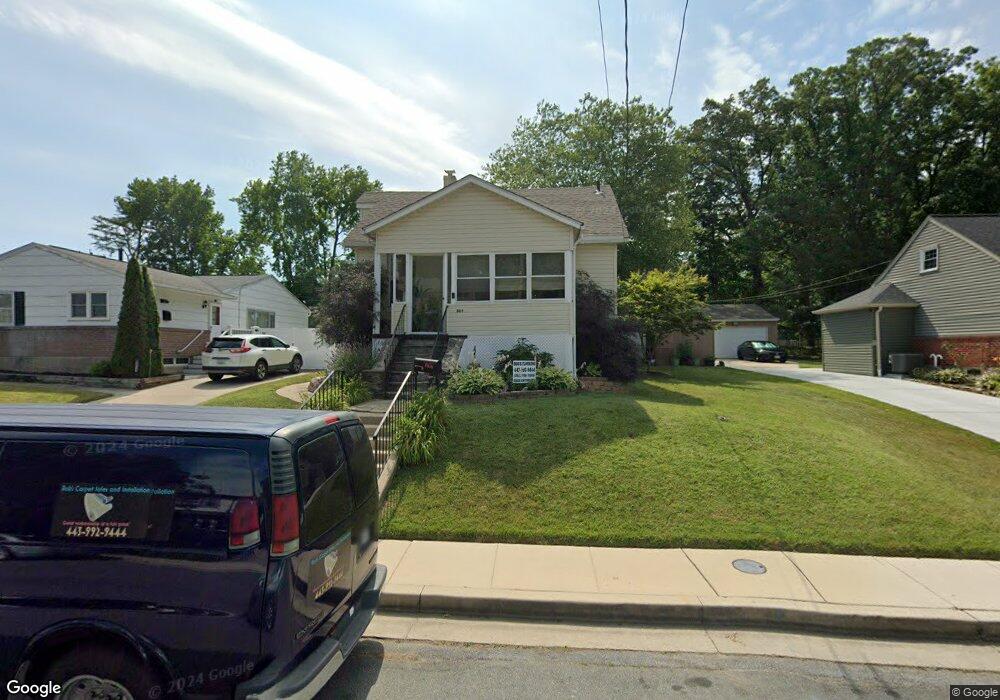
8614 Wendell Ave Parkville, MD 21234
Estimated Value: $272,000 - $300,000
--
Bed
1
Bath
1,298
Sq Ft
$223/Sq Ft
Est. Value
About This Home
This home is located at 8614 Wendell Ave, Parkville, MD 21234 and is currently estimated at $289,382, approximately $222 per square foot. 8614 Wendell Ave is a home located in Baltimore County with nearby schools including Oakleigh Elementary School, Parkville Middle & Center of Technology, and Parkville High School.
Ownership History
Date
Name
Owned For
Owner Type
Purchase Details
Closed on
Jan 3, 2008
Sold by
Cohen Jeremy
Bought by
Timmerman Robert J and Bonn Carina E
Current Estimated Value
Home Financials for this Owner
Home Financials are based on the most recent Mortgage that was taken out on this home.
Original Mortgage
$43,600
Interest Rate
6.23%
Mortgage Type
Stand Alone Second
Purchase Details
Closed on
Feb 12, 2007
Sold by
Cohen Jeremy
Bought by
Timmerman Robert J and Bonn Carina E
Home Financials for this Owner
Home Financials are based on the most recent Mortgage that was taken out on this home.
Original Mortgage
$174,400
Interest Rate
8.95%
Mortgage Type
Balloon
Purchase Details
Closed on
Aug 9, 2005
Sold by
Brinegar Lisa Kendall
Bought by
Cohen Jeremy
Purchase Details
Closed on
Aug 28, 2003
Sold by
Kendall Charles V
Bought by
Brinegar Lisa Kendall
Create a Home Valuation Report for This Property
The Home Valuation Report is an in-depth analysis detailing your home's value as well as a comparison with similar homes in the area
Home Values in the Area
Average Home Value in this Area
Purchase History
| Date | Buyer | Sale Price | Title Company |
|---|---|---|---|
| Timmerman Robert J | $218,000 | -- | |
| Timmerman Robert J | $218,000 | -- | |
| Cohen Jeremy | $160,000 | -- | |
| Brinegar Lisa Kendall | -- | -- |
Source: Public Records
Mortgage History
| Date | Status | Borrower | Loan Amount |
|---|---|---|---|
| Closed | Timmerman Robert J | $43,600 | |
| Open | Timmerman Robert J | $174,400 | |
| Previous Owner | Timmerman Robert J | $174,400 |
Source: Public Records
Tax History Compared to Growth
Tax History
| Year | Tax Paid | Tax Assessment Tax Assessment Total Assessment is a certain percentage of the fair market value that is determined by local assessors to be the total taxable value of land and additions on the property. | Land | Improvement |
|---|---|---|---|---|
| 2025 | $4,563 | $216,167 | -- | -- |
| 2024 | $4,563 | $201,833 | $0 | $0 |
| 2023 | $2,023 | $187,500 | $72,700 | $114,800 |
| 2022 | $3,819 | $184,633 | $0 | $0 |
| 2021 | $3,352 | $181,767 | $0 | $0 |
| 2020 | $3,352 | $178,900 | $72,700 | $106,200 |
| 2019 | $3,281 | $175,700 | $0 | $0 |
| 2018 | $3,058 | $172,500 | $0 | $0 |
| 2017 | $3,314 | $169,300 | $0 | $0 |
| 2016 | $2,988 | $161,767 | $0 | $0 |
| 2015 | $2,988 | $154,233 | $0 | $0 |
| 2014 | $2,988 | $146,700 | $0 | $0 |
Source: Public Records
Map
Nearby Homes
- 8602 David Ave
- 8703 Wendell Ave
- 16 Parkwind Ct
- 3339 Acton Rd
- 3332 Texas Ave
- 3640 Rockberry Rd
- 3743 Double Rock Ln
- 8812 Avondale Rd
- 8819 Green Needle Dr
- 8830 Baker Ave
- 8308 Wilson Ave
- 3111 Willoughby Rd
- 3109 Hiss Ave
- 3113 California Ave
- 3107 California Ave
- 3048 Edgewood Ave
- 3108 Texas Ave
- 3112 California Ave
- 3040 Woodside Ave
- 7839 Bagley Ave
- 8612 Wendell Ave
- 8616 Wendell Ave
- 8610 Wendell Ave
- 8618 Wendell Ave
- 8608 Wendell Ave
- 8617 Wendell Ave
- 8615 Wendell Ave
- 8619 Wendell Ave
- 8611 Wendell Ave
- 8621 Wendell Ave
- 8606 Wendell Ave
- 8700 Wendell Ave
- 8609 Wendell Ave
- 8623 Wendell Ave
- 8604 Wendell Ave
- 8607 Wendell Ave
- 8702 Wendell Ave
- 8701 Wendell Ave
- 8605 Wendell Ave
- 8602 Wendell Ave