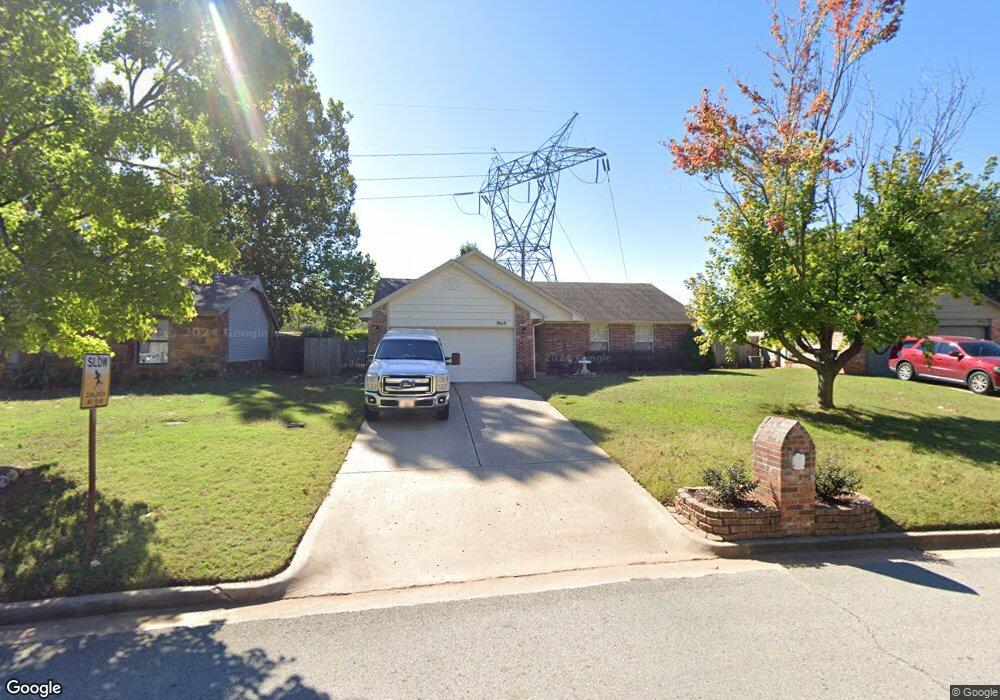
8618 E 135th St S Bixby, OK 74008
North Bixby NeighborhoodEstimated Value: $208,000 - $234,000
3
Beds
2
Baths
1,358
Sq Ft
$163/Sq Ft
Est. Value
About This Home
This home is located at 8618 E 135th St S, Bixby, OK 74008 and is currently estimated at $221,726, approximately $163 per square foot. 8618 E 135th St S is a home located in Tulsa County with nearby schools including Bixby East Elementary, Bixby Middle School, and Bixby High School.
Ownership History
Date
Name
Owned For
Owner Type
Purchase Details
Closed on
Mar 7, 2016
Sold by
Mica Stefoni and Mica Robert A
Bought by
Reaper Customs Llc
Current Estimated Value
Purchase Details
Closed on
Oct 27, 2015
Sold by
Adams Angelamary R and Adams Angelamary R
Bought by
Mica Stefoni and Mica M
Home Financials for this Owner
Home Financials are based on the most recent Mortgage that was taken out on this home.
Original Mortgage
$92,800
Interest Rate
3.96%
Mortgage Type
New Conventional
Purchase Details
Closed on
Dec 9, 2003
Sold by
Lester Michael Todd and Lester Sarah Irene
Bought by
Raguse Jean F and Jean F Raguse Declaration Of Trust
Home Financials for this Owner
Home Financials are based on the most recent Mortgage that was taken out on this home.
Original Mortgage
$77,600
Interest Rate
5.94%
Mortgage Type
Purchase Money Mortgage
Purchase Details
Closed on
Dec 1, 1994
Create a Home Valuation Report for This Property
The Home Valuation Report is an in-depth analysis detailing your home's value as well as a comparison with similar homes in the area
Home Values in the Area
Average Home Value in this Area
Purchase History
| Date | Buyer | Sale Price | Title Company |
|---|---|---|---|
| Reaper Customs Llc | -- | American Eagle Title & Abstr | |
| Mica Stefoni | $116,000 | First American Title | |
| Raguse Jean F | $97,000 | Firstitle & Abstract Svcs In | |
| -- | $68,000 | -- |
Source: Public Records
Mortgage History
| Date | Status | Borrower | Loan Amount |
|---|---|---|---|
| Previous Owner | Mica Stefoni | $92,800 | |
| Previous Owner | Raguse Jean F | $77,600 |
Source: Public Records
Tax History Compared to Growth
Tax History
| Year | Tax Paid | Tax Assessment Tax Assessment Total Assessment is a certain percentage of the fair market value that is determined by local assessors to be the total taxable value of land and additions on the property. | Land | Improvement |
|---|---|---|---|---|
| 2024 | $2,053 | $15,408 | $2,254 | $13,154 |
| 2023 | $2,053 | $14,674 | $2,445 | $12,229 |
| 2022 | $1,964 | $13,975 | $3,165 | $10,810 |
| 2021 | $1,748 | $13,310 | $3,015 | $10,295 |
| 2020 | $1,759 | $13,310 | $3,015 | $10,295 |
| 2019 | $1,766 | $13,310 | $3,015 | $10,295 |
| 2018 | $1,670 | $12,705 | $2,878 | $9,827 |
| 2017 | $1,659 | $12,705 | $2,878 | $9,827 |
| 2016 | $1,646 | $12,760 | $2,878 | $11,151 |
| 2015 | $1,667 | $14,029 | $2,878 | $11,151 |
| 2014 | $1,585 | $12,870 | $2,640 | $10,230 |
Source: Public Records
Map
Nearby Homes
- 8731 E 136th St S
- 13313 S 85th Ave E
- 8410 E 133rd St S
- 13542 S 91st East Ave
- 9016 E 132nd St S
- 10020 E 135th Place
- 10116 E 135th Place
- 13176 S 92nd East Ave
- 13155 S 92nd East Ave
- 13116 S 92nd Ave E
- 10101 E 134th Place S
- 7850 E 132nd St S
- 9516 E 131st Place S
- 10204 E 131st Place S
- 10417 E 131st Place S
- 10113 E 131st Place S
- 10105 E 131st Place S
- 9533 E 131st Place S
- 9533 E 136th St S
- 7505 E 133rd Place S Unit 217
- 8614 E 135th St S
- 8610 E 135th St S
- 8626 E 135th St S
- 8617 E 135th St S
- 8630 E 135th St S
- 8549 E 136th St S
- 8606 E 135th St S
- 8623 E 135th St S
- 8573 E 136th St S
- 13421 S 86th East Ave
- 8634 E 135th St S
- 13420 S 87th East Ave
- 8602 E 135th St S
- 8591 E 136th St S
- 13417 S 86th East Ave
- 13413 S 86th East Ave
- 13416 S 87th East Ave
- 8704 E 135th St S
- 8603 E 136th St S
- 8520 E 135th St S