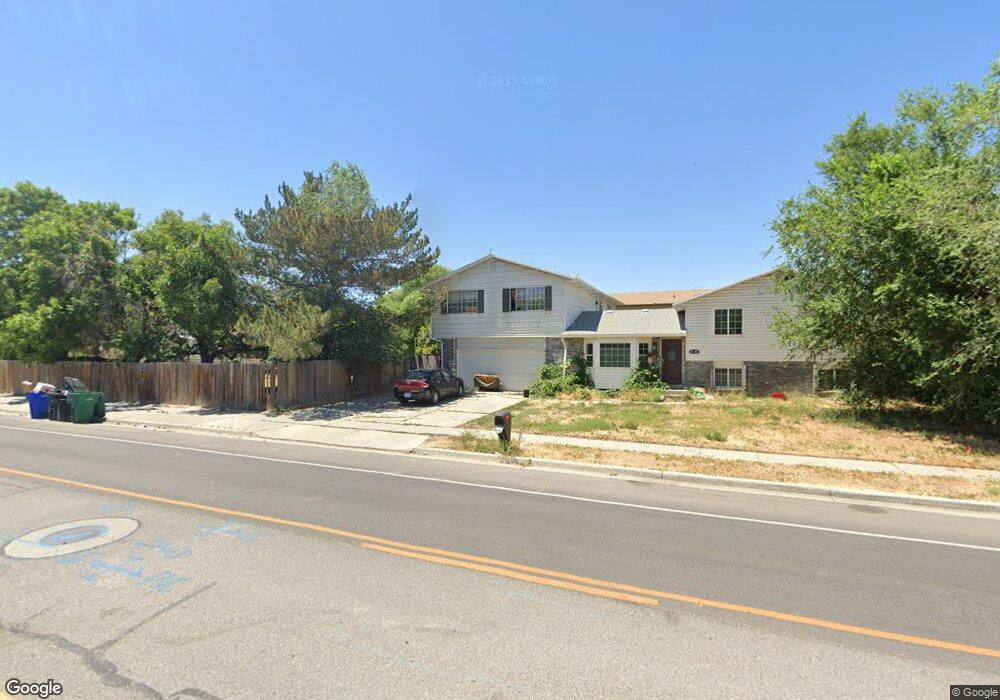
8618 S 1300 W West Jordan, UT 84088
Estimated Value: $581,000 - $779,000
11
Beds
5
Baths
3,876
Sq Ft
$174/Sq Ft
Est. Value
About This Home
This home is located at 8618 S 1300 W, West Jordan, UT 84088 and is currently estimated at $674,649, approximately $174 per square foot. 8618 S 1300 W is a home located in Salt Lake County with nearby schools including Riverside Elementary School, West Jordan Middle School, and West Jordan High School.
Ownership History
Date
Name
Owned For
Owner Type
Purchase Details
Closed on
May 19, 2004
Sold by
White Karen E and Condie Dana J
Bought by
Ppmc Inc
Current Estimated Value
Purchase Details
Closed on
Jul 25, 2002
Sold by
Jensen Tina L
Bought by
White Karen E and Condie Dana J
Home Financials for this Owner
Home Financials are based on the most recent Mortgage that was taken out on this home.
Original Mortgage
$157,500
Interest Rate
6.7%
Purchase Details
Closed on
Jun 10, 2002
Sold by
Keate Leland S and Keate Verna L
Bought by
Jensen Tina L
Home Financials for this Owner
Home Financials are based on the most recent Mortgage that was taken out on this home.
Original Mortgage
$157,500
Interest Rate
6.7%
Purchase Details
Closed on
Nov 21, 1996
Sold by
Keate Leland S
Bought by
Keate Leland S and Keate Verna L
Home Financials for this Owner
Home Financials are based on the most recent Mortgage that was taken out on this home.
Original Mortgage
$155,250
Interest Rate
7.88%
Create a Home Valuation Report for This Property
The Home Valuation Report is an in-depth analysis detailing your home's value as well as a comparison with similar homes in the area
Home Values in the Area
Average Home Value in this Area
Purchase History
| Date | Buyer | Sale Price | Title Company |
|---|---|---|---|
| Ppmc Inc | $188,000 | -- | |
| White Karen E | -- | Equity Title | |
| Jensen Tina L | -- | Equity Title | |
| Keate Leland S | -- | Bonneville Title Company |
Source: Public Records
Mortgage History
| Date | Status | Borrower | Loan Amount |
|---|---|---|---|
| Previous Owner | White Karen E | $157,500 | |
| Previous Owner | Keate Leland S | $155,250 | |
| Closed | White Karen E | $52,500 |
Source: Public Records
Tax History Compared to Growth
Tax History
| Year | Tax Paid | Tax Assessment Tax Assessment Total Assessment is a certain percentage of the fair market value that is determined by local assessors to be the total taxable value of land and additions on the property. | Land | Improvement |
|---|---|---|---|---|
| 2025 | $2,651 | $538,700 | $128,500 | $410,200 |
| 2024 | $2,651 | $510,000 | $118,300 | $391,700 |
| 2023 | $2,636 | $478,000 | $113,700 | $364,300 |
| 2022 | $2,760 | $492,400 | $111,500 | $380,900 |
| 2021 | $2,359 | $383,100 | $85,600 | $297,500 |
| 2020 | $2,257 | $344,000 | $74,000 | $270,000 |
| 2019 | $2,175 | $325,000 | $74,000 | $251,000 |
| 2018 | $1,974 | $292,600 | $70,800 | $221,800 |
| 2017 | $1,838 | $271,200 | $70,800 | $200,400 |
| 2016 | $1,693 | $234,800 | $70,800 | $164,000 |
| 2015 | $1,433 | $193,700 | $75,500 | $118,200 |
| 2014 | $1,264 | $168,300 | $67,400 | $100,900 |
Source: Public Records
Map
Nearby Homes
- 8686 S Temple Dr
- 1434 Autumn Oak Cir
- 1254 W 8680 S
- 1352 W 8780 S
- 1424 Stone Meadow Dr
- 1401 W Stone Meadow Dr
- 8772 S Midvalley Dr
- 8713 Mountain Meadow Dr
- 8686 Covewood Place
- 8843 Capernaum Rd
- 1633 W Rockaway Ln
- 8534 S Redwood Rd
- 8518 S Redwood Rd
- 8510 S Redwood Rd
- 1773 W 8760 S
- 1689 W 8295 S Unit 2
- 8976 S 1050 W
- 1184 W Michaelsen Way
- 9141 S Little Creek Dr
- 9095 S 1150 W
- 1323 W 8605 S
- 1335 W 8605 S
- 8591 S 1330 W
- 1287 W 8600 S
- 1312 W Melanie Place Ln
- 1312 Melanie Place Ln
- 1326 Melanie Place Ln
- 1326 W Melanie Place Ln
- 1281 W 8600 S
- 1345 W 8605 S
- 8588 S 1330 W
- 1277 W 8600 S
- 8581 S 1330 W
- 1334 W Melanie Place Ln
- 1334 Melanie Place Ln
- 1288 W 8600 S
- 1288 W 8600 S Unit Lot 1
- 8633 S 1300 W
- 1353 W 8580 S
- 8635 S 1365 W