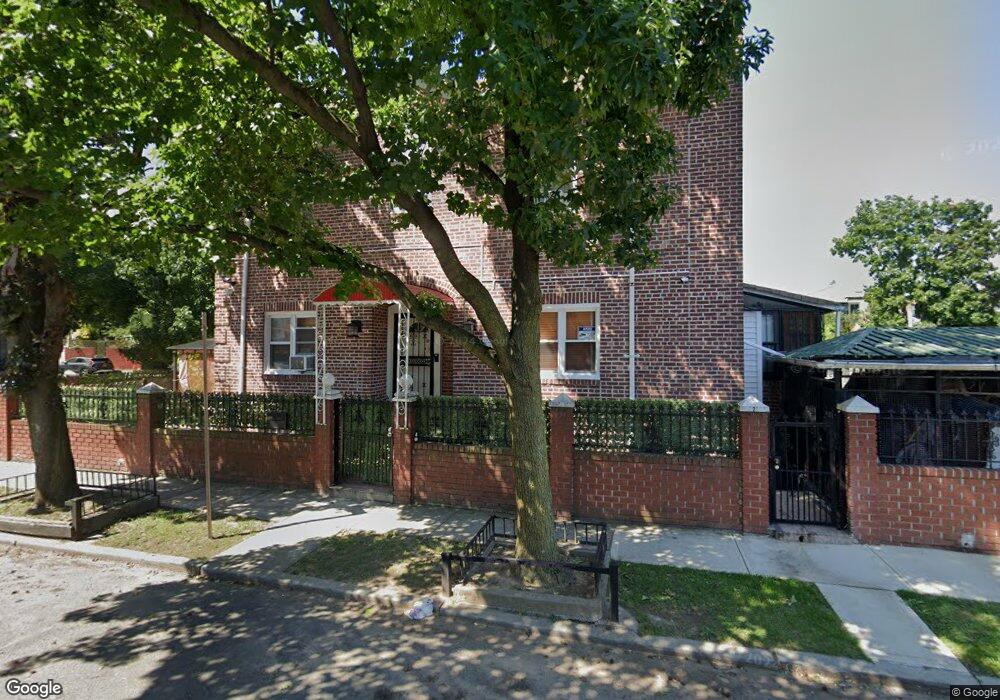
8619 30th Ave East Elmhurst, NY 11369
Jackson Heights NeighborhoodEstimated Value: $827,028 - $1,007,000
--
Bed
--
Bath
1,224
Sq Ft
$754/Sq Ft
Est. Value
About This Home
This home is located at 8619 30th Ave, East Elmhurst, NY 11369 and is currently estimated at $922,757, approximately $753 per square foot. 8619 30th Ave is a home located in Queens County with nearby schools including P.S. 148, I.S. 145 Joseph Pulitzer Magnet School, and Newtown High School.
Ownership History
Date
Name
Owned For
Owner Type
Purchase Details
Closed on
Jan 14, 2002
Sold by
Hernandez Silverio and Hernandez Patricia
Bought by
Figueroa Manuel Pardo and Guerra Yderma Poma
Current Estimated Value
Home Financials for this Owner
Home Financials are based on the most recent Mortgage that was taken out on this home.
Original Mortgage
$255,200
Outstanding Balance
$104,583
Interest Rate
7.08%
Estimated Equity
$818,174
Create a Home Valuation Report for This Property
The Home Valuation Report is an in-depth analysis detailing your home's value as well as a comparison with similar homes in the area
Home Values in the Area
Average Home Value in this Area
Purchase History
| Date | Buyer | Sale Price | Title Company |
|---|---|---|---|
| Figueroa Manuel Pardo | -- | -- |
Source: Public Records
Mortgage History
| Date | Status | Borrower | Loan Amount |
|---|---|---|---|
| Open | Figueroa Manuel Pardo | $255,200 |
Source: Public Records
Tax History Compared to Growth
Tax History
| Year | Tax Paid | Tax Assessment Tax Assessment Total Assessment is a certain percentage of the fair market value that is determined by local assessors to be the total taxable value of land and additions on the property. | Land | Improvement |
|---|---|---|---|---|
| 2025 | $6,635 | $36,501 | $5,990 | $30,511 |
| 2024 | $3,189 | $34,435 | $5,778 | $28,657 |
| 2023 | $6,635 | $34,435 | $6,390 | $28,045 |
| 2022 | $6,069 | $45,420 | $8,940 | $36,480 |
| 2021 | $6,489 | $46,560 | $8,940 | $37,620 |
| 2020 | $6,143 | $40,440 | $8,940 | $31,500 |
| 2019 | $5,710 | $42,120 | $8,940 | $33,180 |
| 2018 | $5,552 | $28,696 | $6,224 | $22,472 |
| 2017 | $5,397 | $27,945 | $6,506 | $21,439 |
| 2016 | $5,061 | $27,945 | $6,506 | $21,439 |
| 2015 | $2,960 | $25,348 | $7,382 | $17,966 |
| 2014 | $2,960 | $23,914 | $7,971 | $15,943 |
Source: Public Records
Map
Nearby Homes