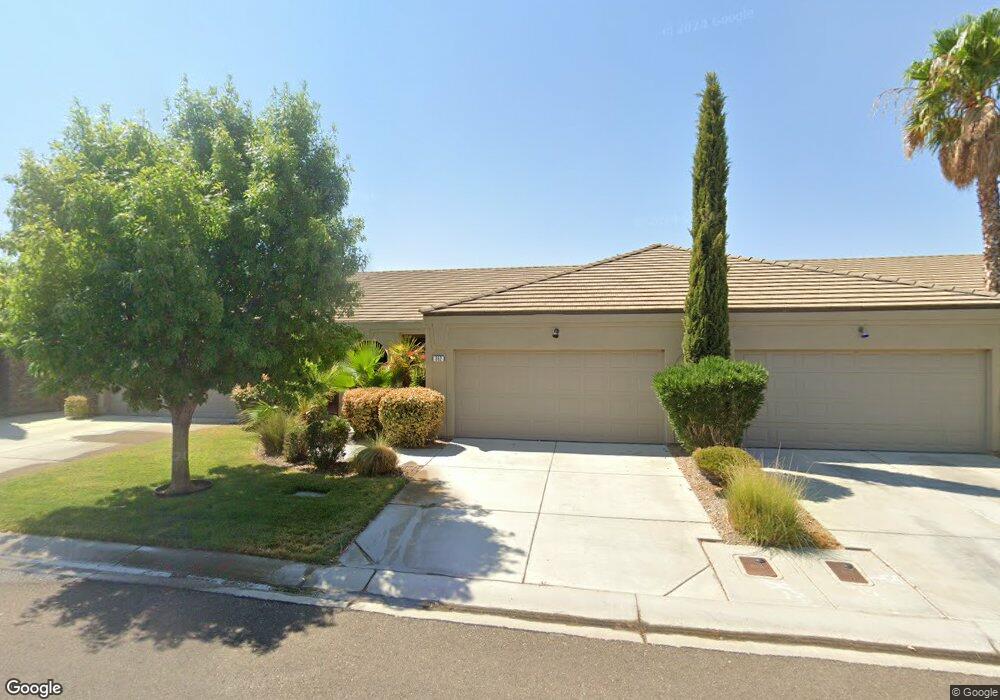
862 Jensen Dr Mesquite, NV 89027
Estimated Value: $283,132 - $331,000
2
Beds
2
Baths
1,360
Sq Ft
$232/Sq Ft
Est. Value
About This Home
This home is located at 862 Jensen Dr, Mesquite, NV 89027 and is currently estimated at $315,033, approximately $231 per square foot. 862 Jensen Dr is a home located in Clark County with nearby schools including Virgin Valley Elementary School, Charles Arthur Hughes Middle School, and Virgin Valley High School.
Ownership History
Date
Name
Owned For
Owner Type
Purchase Details
Closed on
Jan 17, 2020
Sold by
Necaise Russell J and Necaise Jill M
Bought by
Ragland Frank M and Ragland Judy L
Current Estimated Value
Purchase Details
Closed on
Jun 27, 2016
Sold by
Necaise Russell J and Necaise Jill M
Bought by
Necaise Russell J and Necaise Jill M
Purchase Details
Closed on
Feb 5, 2016
Sold by
Us Bank Na
Bought by
Necaise Russell J and Necaise Jill M
Purchase Details
Closed on
Dec 14, 2015
Sold by
Thom Robert J and Thom Carol A
Bought by
U S Bank Na
Purchase Details
Closed on
Jul 12, 2005
Sold by
Zmh Development Inc
Bought by
Thom Robert J and Thom Carol A
Home Financials for this Owner
Home Financials are based on the most recent Mortgage that was taken out on this home.
Original Mortgage
$165,000
Interest Rate
5.55%
Mortgage Type
Fannie Mae Freddie Mac
Create a Home Valuation Report for This Property
The Home Valuation Report is an in-depth analysis detailing your home's value as well as a comparison with similar homes in the area
Purchase History
| Date | Buyer | Sale Price | Title Company |
|---|---|---|---|
| Ragland Frank M | $230,000 | Fidelity National Title M | |
| Necaise Russell J | -- | None Available | |
| Necaise Russell J | $155,000 | Equity Title Of Nevada | |
| U S Bank Na | $171,969 | Servicelink | |
| Thom Robert J | $223,755 | -- |
Source: Public Records
Mortgage History
| Date | Status | Borrower | Loan Amount |
|---|---|---|---|
| Previous Owner | Thom Robert J | $165,000 |
Source: Public Records
Tax History
| Year | Tax Paid | Tax Assessment Tax Assessment Total Assessment is a certain percentage of the fair market value that is determined by local assessors to be the total taxable value of land and additions on the property. | Land | Improvement |
|---|---|---|---|---|
| 2026 | $1,559 | $88,486 | $25,025 | $63,461 |
| 2025 | $1,514 | $88,267 | $25,025 | $63,242 |
| 2024 | $1,471 | $88,267 | $25,025 | $63,242 |
| 2023 | $1,471 | $80,382 | $22,680 | $57,702 |
| 2022 | $1,428 | $77,385 | $22,680 | $54,705 |
| 2021 | $1,386 | $64,570 | $19,688 | $44,882 |
| 2020 | $1,392 | $66,363 | $19,688 | $46,675 |
| 2019 | $1,305 | $66,013 | $19,688 | $46,325 |
| 2018 | $1,245 | $58,794 | $14,438 | $44,356 |
| 2017 | $1,553 | $55,625 | $11,813 | $43,812 |
| 2016 | $1,165 | $50,716 | $11,813 | $38,903 |
| 2015 | $1,162 | $46,020 | $11,813 | $34,207 |
| 2014 | $1,126 | $44,068 | $8,750 | $35,318 |
Source: Public Records
Map
Nearby Homes
- 375 Habib Way
- 463 Hagens Aly
- 364 Sam Way
- 775 Moss Dr Unit 7
- 317 Sam Way
- 307 Sam Way
- 287 Sam Way
- 476 Lewis St
- 257 Vineyard Ln
- 271 Concord Dr
- 777 2nd St S
- 121 Hermosa Way
- 262 Thistle St
- 228 Hiawatha Way
- 162 Hermosa Way
- 443 2nd South St
- 517 W Mesquite Blvd
- 840 W Pioneer
- 879 Glendale Rd
- 921 Shadow Hawk Ridge
Your Personal Tour Guide
Ask me questions while you tour the home.