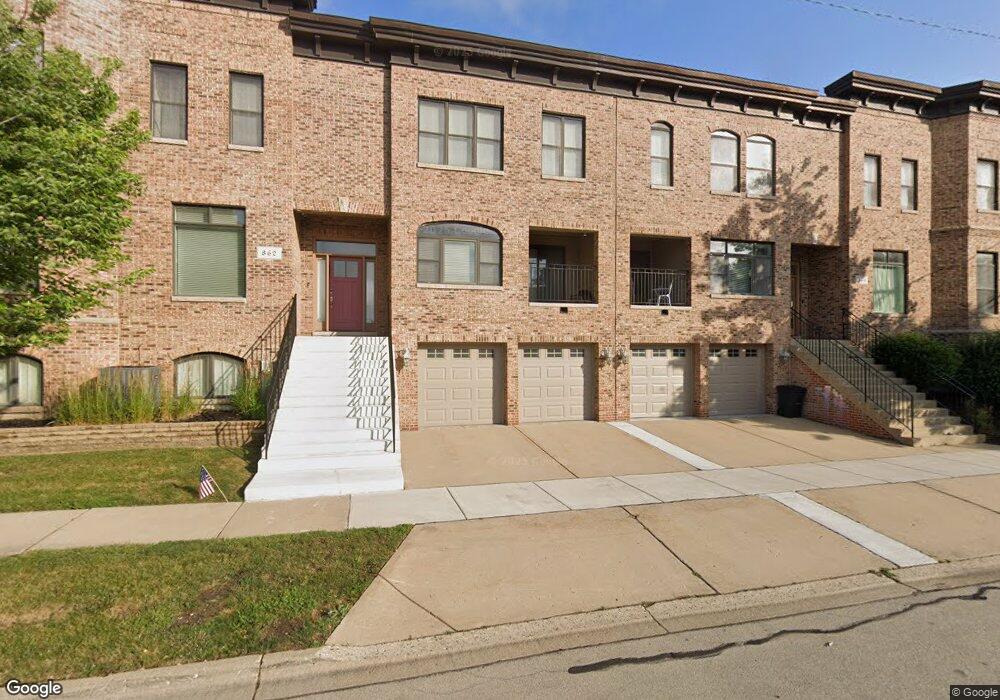
862 N Illinois Ave Unit 1 Arlington Heights, IL 60004
Estimated Value: $625,655 - $673,000
3
Beds
4
Baths
2,486
Sq Ft
$261/Sq Ft
Est. Value
About This Home
This home is located at 862 N Illinois Ave Unit 1, Arlington Heights, IL 60004 and is currently estimated at $649,414, approximately $261 per square foot. 862 N Illinois Ave Unit 1 is a home located in Cook County with nearby schools including Patton Elementary School, Thomas Middle School, and John Hersey High School.
Ownership History
Date
Name
Owned For
Owner Type
Purchase Details
Closed on
Mar 1, 2017
Sold by
Fedko Martin and Fedko Andrea
Bought by
Five Star Declaration Of Trust
Current Estimated Value
Purchase Details
Closed on
Oct 10, 2013
Sold by
Klimas Christophre A and Klimas Jennifer A
Bought by
Fedko Martin and Fedko Andrea
Home Financials for this Owner
Home Financials are based on the most recent Mortgage that was taken out on this home.
Original Mortgage
$397,664
Interest Rate
4.25%
Mortgage Type
FHA
Purchase Details
Closed on
Sep 25, 2008
Sold by
Frontier Development Partners Llc
Bought by
Klimas Christopher A and Leeds Jennifer A
Home Financials for this Owner
Home Financials are based on the most recent Mortgage that was taken out on this home.
Original Mortgage
$417,000
Interest Rate
6.87%
Mortgage Type
Unknown
Create a Home Valuation Report for This Property
The Home Valuation Report is an in-depth analysis detailing your home's value as well as a comparison with similar homes in the area
Home Values in the Area
Average Home Value in this Area
Purchase History
| Date | Buyer | Sale Price | Title Company |
|---|---|---|---|
| Five Star Declaration Of Trust | $390,000 | Greater Illinois Title | |
| Fedko Martin | $405,000 | Multiple | |
| Klimas Christopher A | $465,000 | Chicago Title Insurance Co |
Source: Public Records
Mortgage History
| Date | Status | Borrower | Loan Amount |
|---|---|---|---|
| Previous Owner | Fedko Martin | $397,664 | |
| Previous Owner | Klimas Christopher A | $417,000 |
Source: Public Records
Tax History Compared to Growth
Tax History
| Year | Tax Paid | Tax Assessment Tax Assessment Total Assessment is a certain percentage of the fair market value that is determined by local assessors to be the total taxable value of land and additions on the property. | Land | Improvement |
|---|---|---|---|---|
| 2024 | $12,867 | $47,000 | $6,000 | $41,000 |
| 2023 | $12,392 | $47,000 | $6,000 | $41,000 |
| 2022 | $12,392 | $47,000 | $6,000 | $41,000 |
| 2021 | $10,308 | $34,242 | $1,585 | $32,657 |
| 2020 | $10,041 | $34,242 | $1,585 | $32,657 |
| 2019 | $9,989 | $38,047 | $1,585 | $36,462 |
| 2018 | $11,874 | $40,688 | $1,394 | $39,294 |
| 2017 | $11,734 | $40,688 | $1,394 | $39,294 |
| 2016 | $10,944 | $40,688 | $1,394 | $39,294 |
| 2015 | $11,958 | $40,500 | $1,204 | $39,296 |
| 2014 | $11,609 | $40,500 | $1,204 | $39,296 |
| 2013 | $10,583 | $40,500 | $1,204 | $39,296 |
Source: Public Records
Map
Nearby Homes
- 617 N Wilke Rd
- 1105 N Harvard Ave
- 628 S Wilke Rd
- 1307 W Mulberry Ln
- 1442 E Katie Ln
- 406 N Yale Ave
- 1326 N Race Ave
- 1418 W Saint James Place
- 543 S Warren Ave
- 1108 W Miner St
- 1419 W Miner St
- 2201 Wren Ln
- 2207 Eastman St
- 827 N Walnut Ave
- 1136 N Walnut Ave
- 1302 W Campbell St
- 1750 W Thomas St
- 1237 N Ridge Ave
- 1142 N Mitchell Ave
- 1539 E Baronet Ln Unit 130420
- 862 N Illinois Ave
- 1502 W Northwest Hwy
- 864 N Illinois Ave
- 864 N Illinois Ave Unit 1
- 1506 W Northwest Hwy
- 1512 W Northwest Hwy
- 1518 W Northwest Hwy
- 1522 W Northwest Hwy
- 900 N Illinois Ave
- 1526 W Northwest Hwy
- 1526 W Northwest Hwy Unit 1506
- 1417 W Elm St
- 1530 W Northwest Hwy
- 901 N Chicago Ave
- 902 N Illinois Ave
- 903 N Chicago Ave
- 1415 W Elm St
- 906 N Illinois Ave
- 907 N Chicago Ave
- 903 N Illinois Ave