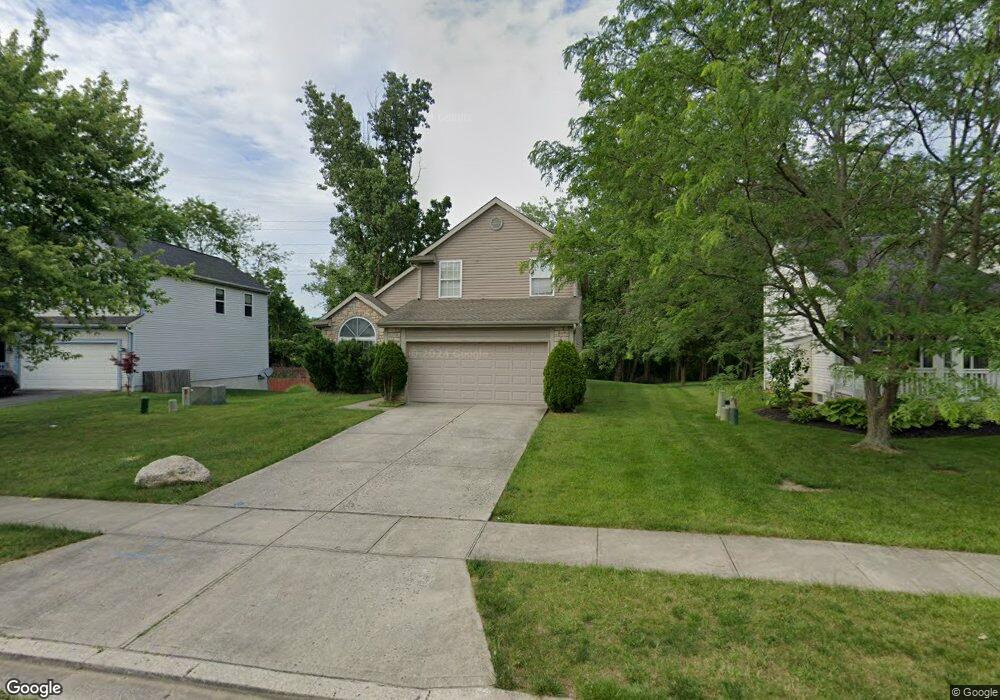
8620 Robbins Loop Dr Reynoldsburg, OH 43068
Estimated Value: $348,000 - $354,000
3
Beds
3
Baths
1,960
Sq Ft
$179/Sq Ft
Est. Value
About This Home
This home is located at 8620 Robbins Loop Dr, Reynoldsburg, OH 43068 and is currently estimated at $350,934, approximately $179 per square foot. 8620 Robbins Loop Dr is a home located in Licking County with nearby schools including Taylor Road Elementary School, Waggoner Road Elementary School, and Waggoner Road Junior High School.
Ownership History
Date
Name
Owned For
Owner Type
Purchase Details
Closed on
Feb 20, 2018
Sold by
Sow Raguatou
Bought by
Diallo Mamadou Saliou
Current Estimated Value
Purchase Details
Closed on
Jun 11, 2010
Sold by
Secretary Of Housing & Urban Development
Bought by
Diallo Mamadou Saliou and Sow Raquiatou
Home Financials for this Owner
Home Financials are based on the most recent Mortgage that was taken out on this home.
Original Mortgage
$113,471
Interest Rate
5.12%
Mortgage Type
FHA
Purchase Details
Closed on
Feb 25, 2010
Sold by
Levengood George R
Bought by
Wells Fargo Bank Na
Purchase Details
Closed on
Jan 14, 2010
Sold by
Wells Fargo Bank Na
Bought by
Secretary Of Housing & Urban Development
Purchase Details
Closed on
Mar 10, 2006
Sold by
Homewood Corp
Bought by
Levengood George R
Home Financials for this Owner
Home Financials are based on the most recent Mortgage that was taken out on this home.
Original Mortgage
$199,498
Interest Rate
6.37%
Mortgage Type
FHA
Create a Home Valuation Report for This Property
The Home Valuation Report is an in-depth analysis detailing your home's value as well as a comparison with similar homes in the area
Home Values in the Area
Average Home Value in this Area
Purchase History
| Date | Buyer | Sale Price | Title Company |
|---|---|---|---|
| Diallo Mamadou Saliou | -- | None Available | |
| Diallo Mamadou Saliou | $115,000 | Lakeside T | |
| Wells Fargo Bank Na | $116,667 | None Available | |
| Secretary Of Housing & Urban Development | -- | None Available | |
| Levengood George R | $202,700 | Landame |
Source: Public Records
Mortgage History
| Date | Status | Borrower | Loan Amount |
|---|---|---|---|
| Previous Owner | Diallo Mamadou Saliou | $113,471 | |
| Previous Owner | Levengood George R | $199,498 |
Source: Public Records
Tax History Compared to Growth
Tax History
| Year | Tax Paid | Tax Assessment Tax Assessment Total Assessment is a certain percentage of the fair market value that is determined by local assessors to be the total taxable value of land and additions on the property. | Land | Improvement |
|---|---|---|---|---|
| 2024 | $4,056 | $101,370 | $23,910 | $77,460 |
| 2023 | $4,047 | $101,370 | $23,910 | $77,460 |
| 2022 | $3,106 | $60,560 | $11,940 | $48,620 |
| 2021 | $3,104 | $60,560 | $11,940 | $48,620 |
| 2020 | $3,178 | $60,560 | $11,940 | $48,620 |
| 2019 | $3,653 | $60,560 | $11,940 | $48,620 |
| 2018 | $3,675 | $0 | $0 | $0 |
| 2017 | $3,328 | $0 | $0 | $0 |
| 2016 | $2,887 | $0 | $0 | $0 |
| 2015 | $2,794 | $0 | $0 | $0 |
| 2014 | $4,242 | $0 | $0 | $0 |
| 2013 | $2,621 | $0 | $0 | $0 |
Source: Public Records
Map
Nearby Homes
- 8574 Victoria Meadow Ln
- 8774 Ormiston Cir
- 937 Quaint Ct
- 875 Briaro St
- 8344 Bellow Park Dr
- 8536 Kingsley Dr
- 8210 Rodebaugh Rd
- 8675 Kingsley Dr
- 1080 Taylor Mills Dr
- 8145 Rhoderick Cir
- 1066 Celosia Ct
- 8889 Betony Ct SW
- 8697 Kingsley Dr
- 926 Hilton Dr
- 8228 Kingsley Dr
- 1065 Mastell Dr
- 49 Summit Ridge Rd S
- 8056 Summit Rd SW
- 1147 Dawn Dr
- 1182 Sanderling Dr Unit 61182
- 8614 Robbins Loop Dr
- 8626 Robbins Loop Dr
- 8608 Robbins Loop Dr
- 8617 Robbins Loop Dr
- 8602 Robbins Loop Dr
- 8623 Robbins Loop Dr
- 8605 Robbins Loop Dr
- 8596 Robbins Loop Dr
- 765 Robbins Loop Ct
- 8599 Robbins Loop Dr
- 769 Robbins Loop Ct
- 8633 Robbins Loop Dr
- 8600 Firstgate Dr
- 8604 Firstgate Dr
- 761 Robbins Loop Ct
- 8590 Robbins Loop Dr
- 8596 Firstgate Dr
- 8587 Robbins Loop Dr
- 8637 Robbins Loop Dr
- 8608 Firstgate Dr