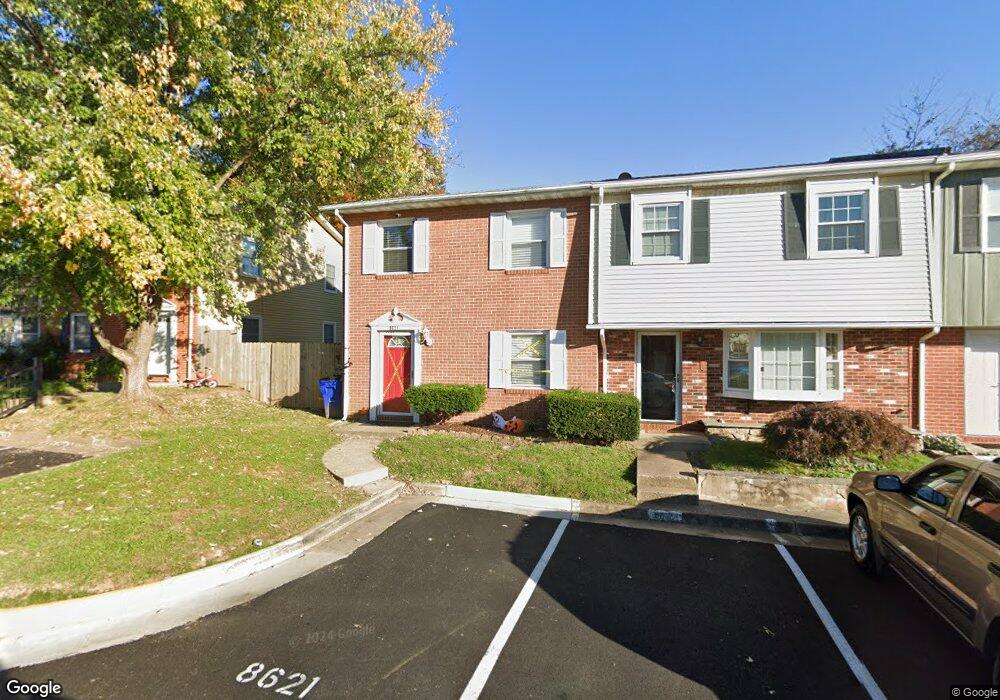
8621 Ashby Ct Marshall, VA 20115
Estimated Value: $310,000 - $357,000
3
Beds
2
Baths
1,240
Sq Ft
$267/Sq Ft
Est. Value
About This Home
This home is located at 8621 Ashby Ct, Marshall, VA 20115 and is currently estimated at $331,495, approximately $267 per square foot. 8621 Ashby Ct is a home located in Fauquier County with nearby schools including Claude Thompson Elementary School, Marshall Middle School, and Fauquier High School.
Ownership History
Date
Name
Owned For
Owner Type
Purchase Details
Closed on
Apr 7, 2017
Sold by
Correa Eduardo and Flores Maribel
Bought by
Correa Eduardo and Flores Maribel
Current Estimated Value
Purchase Details
Closed on
Mar 15, 2010
Sold by
Fannie Mae
Bought by
Correa Eduardo
Purchase Details
Closed on
Jan 28, 2010
Sold by
Professional Foreclosure Corp
Bought by
Federal National Mtg Asoc
Purchase Details
Closed on
Jul 22, 2004
Sold by
Smith Rodney I
Bought by
Arellano Eberto
Home Financials for this Owner
Home Financials are based on the most recent Mortgage that was taken out on this home.
Original Mortgage
$138,600
Interest Rate
6.33%
Mortgage Type
New Conventional
Purchase Details
Closed on
Sep 17, 1997
Sold by
Sec Of Hud
Bought by
Grigsby Moses and Grigsby Rose
Home Financials for this Owner
Home Financials are based on the most recent Mortgage that was taken out on this home.
Original Mortgage
$55,700
Interest Rate
7.38%
Mortgage Type
FHA
Create a Home Valuation Report for This Property
The Home Valuation Report is an in-depth analysis detailing your home's value as well as a comparison with similar homes in the area
Purchase History
| Date | Buyer | Sale Price | Title Company |
|---|---|---|---|
| Correa Eduardo | -- | None Available | |
| Correa Eduardo | $100,000 | -- | |
| Federal National Mtg Asoc | $90,000 | -- | |
| Arellano Eberto | $158,000 | -- | |
| Grigsby Moses | $55,000 | -- |
Source: Public Records
Mortgage History
| Date | Status | Borrower | Loan Amount |
|---|---|---|---|
| Previous Owner | Arellano Eberto | $138,600 | |
| Previous Owner | Grigsby Moses | $55,700 |
Source: Public Records
Tax History
| Year | Tax Paid | Tax Assessment Tax Assessment Total Assessment is a certain percentage of the fair market value that is determined by local assessors to be the total taxable value of land and additions on the property. | Land | Improvement |
|---|---|---|---|---|
| 2025 | $2,150 | $216,700 | $65,000 | $151,700 |
| 2024 | $2,111 | $216,700 | $65,000 | $151,700 |
| 2023 | $2,025 | $216,700 | $65,000 | $151,700 |
| 2022 | $2,025 | $216,700 | $65,000 | $151,700 |
| 2021 | $1,639 | $159,500 | $60,000 | $99,500 |
| 2020 | $1,607 | $159,500 | $60,000 | $99,500 |
| 2019 | $1,607 | $159,500 | $60,000 | $99,500 |
| 2018 | $1,588 | $159,500 | $60,000 | $99,500 |
| 2016 | $1,347 | $127,700 | $50,000 | $77,700 |
| 2015 | -- | $127,700 | $50,000 | $77,700 |
| 2014 | -- | $127,700 | $50,000 | $77,700 |
Source: Public Records
Map
Nearby Homes
- 4519 Appledale Ct
- 4530 Appledale Ct
- 8332 Mauzy Square
- 1045 Captain Richards Ct Unit HOMESITE 141
- 1043 Captain Richards Ct Unit HOMESITE 142
- 1010 Captain Richards Ct Unit HOMESITE 175
- 2611 Blue Ridge Ave Unit HOMESITE 139
- 2576 Blue Ridge Ave Unit HOMESITE 115
- 2593 Blue Ridge Ave Unit HOMESITE 157
- 0 Main St E Unit VAFQ2016288
- 0 Old Stockyard Rd
- 4048 Rectortown Rd
- 8650 Anderson Ave
- 8089 E Main St
- 4460 Scotts Rd
- Crest Hill Rd Crest Hill Rd
- 3863 Rectortown Rd
- 8986 Woodward Rd
- 4364 Belvoir Rd
- 4645 Morgans Bluff Dr
Your Personal Tour Guide
Ask me questions while you tour the home.