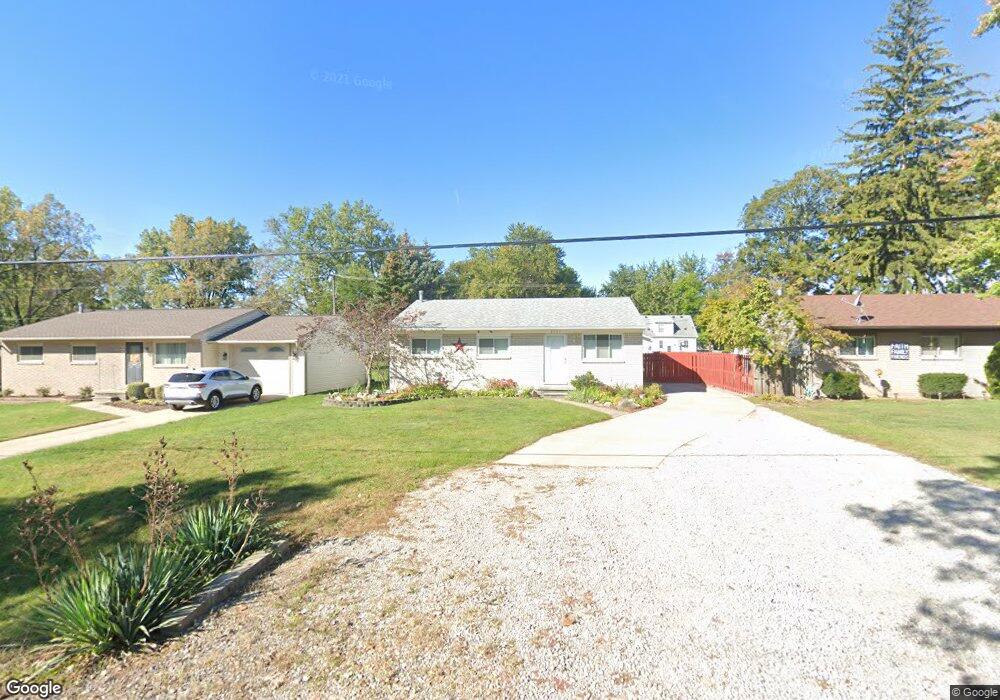
8621 Haller St Westland, MI 48185
Estimated Value: $233,000 - $256,000
3
Beds
2
Baths
1,069
Sq Ft
$231/Sq Ft
Est. Value
About This Home
This home is located at 8621 Haller St, Westland, MI 48185 and is currently estimated at $246,406, approximately $230 per square foot. 8621 Haller St is a home located in Wayne County with nearby schools including Cleveland Elementary School, Emerson Middle School, and Cooper Upper Elementary School.
Ownership History
Date
Name
Owned For
Owner Type
Purchase Details
Closed on
Oct 7, 2019
Sold by
Broyles Steven G
Bought by
Broyles Steven G and Broyles Cynthia
Current Estimated Value
Home Financials for this Owner
Home Financials are based on the most recent Mortgage that was taken out on this home.
Original Mortgage
$65,000
Outstanding Balance
$43,334
Interest Rate
3.5%
Mortgage Type
New Conventional
Estimated Equity
$203,072
Purchase Details
Closed on
Oct 11, 2011
Sold by
The Secretary Of Veterans Affairs
Bought by
Broyles Steven G
Purchase Details
Closed on
Dec 24, 2010
Sold by
Citimortgage Inc
Bought by
Department Of Veterans Affairs
Purchase Details
Closed on
Dec 1, 2010
Sold by
Amburgey Dallas
Bought by
Citimortgage Inc
Purchase Details
Closed on
Nov 5, 2003
Sold by
Miller Paul S and Miller Christine A
Bought by
Amburgey Dallas
Purchase Details
Closed on
Oct 24, 2001
Sold by
Podpora Shirley A
Bought by
Norwest Mtg Inc
Create a Home Valuation Report for This Property
The Home Valuation Report is an in-depth analysis detailing your home's value as well as a comparison with similar homes in the area
Home Values in the Area
Average Home Value in this Area
Purchase History
| Date | Buyer | Sale Price | Title Company |
|---|---|---|---|
| Broyles Steven G | -- | None Available | |
| Broyles Steven G | $50,000 | Title One Inc | |
| Department Of Veterans Affairs | -- | None Available | |
| Citimortgage Inc | $66,098 | None Available | |
| Amburgey Dallas | $152,000 | First American Title Ins Co | |
| Norwest Mtg Inc | $97,597 | -- |
Source: Public Records
Mortgage History
| Date | Status | Borrower | Loan Amount |
|---|---|---|---|
| Open | Broyles Steven G | $65,000 |
Source: Public Records
Tax History Compared to Growth
Tax History
| Year | Tax Paid | Tax Assessment Tax Assessment Total Assessment is a certain percentage of the fair market value that is determined by local assessors to be the total taxable value of land and additions on the property. | Land | Improvement |
|---|---|---|---|---|
| 2025 | $2,137 | $108,100 | $0 | $0 |
| 2024 | $2,137 | $112,800 | $0 | $0 |
| 2023 | $2,041 | $78,300 | $0 | $0 |
| 2022 | $2,304 | $80,600 | $0 | $0 |
| 2021 | $2,250 | $73,000 | $0 | $0 |
| 2020 | $2,228 | $62,700 | $0 | $0 |
| 2019 | $2,118 | $62,200 | $0 | $0 |
| 2018 | $1,723 | $58,800 | $0 | $0 |
| 2017 | $661 | $57,300 | $0 | $0 |
| 2016 | $2,030 | $55,800 | $0 | $0 |
| 2015 | $4,194 | $43,740 | $0 | $0 |
| 2013 | $4,331 | $45,140 | $0 | $0 |
| 2012 | $2,765 | $45,580 | $0 | $0 |
Source: Public Records
Map
Nearby Homes
- 29000 Joy Rd
- 8938 Hugh St
- 9066 Newport Way Unit 11
- 29637 Joy Rd
- 9065 Newport Way Unit 19
- 8618 Beatrice
- 29156 Manchester St
- 8139 Bristol St Unit 170
- 29102 Manchester St
- 29248 Manchester St
- 29047 Manchester St Unit 83
- 8411 Hugh St
- 8483 Beatrice
- 8319 Beatrice
- 9000 Beatrice St
- 8309 Hugh St
- 0000 N Middlebelt Rd
- 9081 Louise St
- 29256 Brody Ave
- 8037 Beatrice