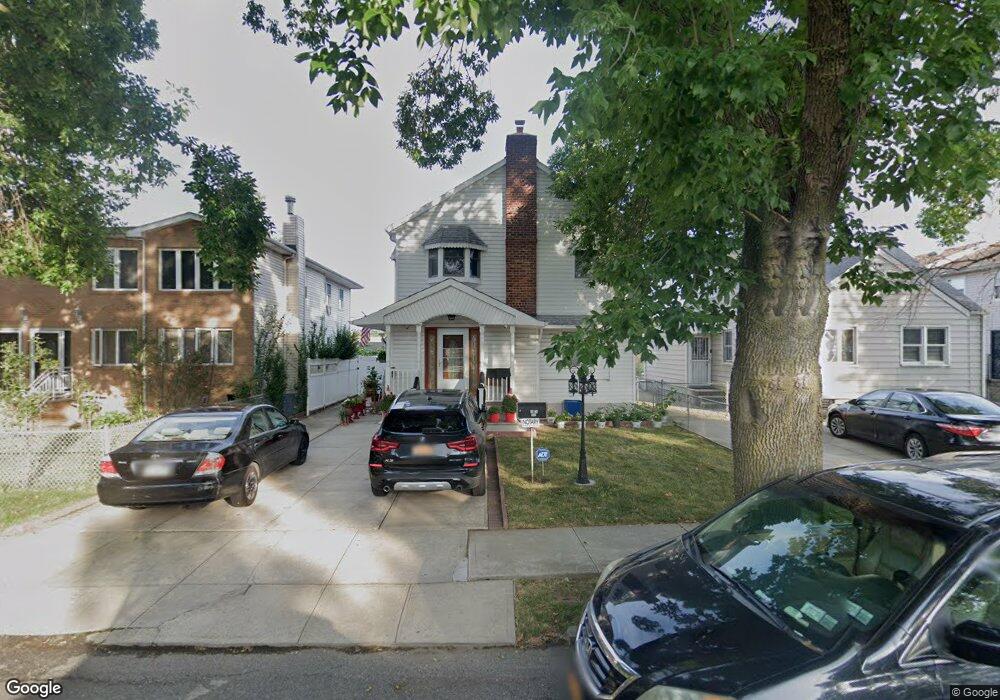
8624 239th St Unit 2nd Fl Bellerose, NY 11426
Bellerose NeighborhoodEstimated Value: $906,192 - $1,334,000
3
Beds
1
Bath
1,930
Sq Ft
$558/Sq Ft
Est. Value
About This Home
This home is located at 8624 239th St Unit 2nd Fl, Bellerose, NY 11426 and is currently estimated at $1,077,798, approximately $558 per square foot. 8624 239th St Unit 2nd Fl is a home located in Queens County with nearby schools including P.S. 18 Q The Winchester School, Irwin Altman Middle School 172, and Martin Van Buren High School.
Ownership History
Date
Name
Owned For
Owner Type
Purchase Details
Closed on
Jun 24, 2019
Sold by
Bir Amritpal S and Bir Sukhwinder K
Bought by
Dhillon Amandeep
Current Estimated Value
Home Financials for this Owner
Home Financials are based on the most recent Mortgage that was taken out on this home.
Original Mortgage
$874,795
Outstanding Balance
$767,599
Interest Rate
4%
Mortgage Type
FHA
Estimated Equity
$310,199
Purchase Details
Closed on
May 18, 2005
Sold by
Imhof Donna M and Imhof John M
Bought by
Bir Amritpal S and Bir Sukhwinder K
Home Financials for this Owner
Home Financials are based on the most recent Mortgage that was taken out on this home.
Original Mortgage
$516,800
Interest Rate
5.83%
Mortgage Type
Purchase Money Mortgage
Create a Home Valuation Report for This Property
The Home Valuation Report is an in-depth analysis detailing your home's value as well as a comparison with similar homes in the area
Home Values in the Area
Average Home Value in this Area
Purchase History
| Date | Buyer | Sale Price | Title Company |
|---|---|---|---|
| Dhillon Amandeep | $950,000 | -- | |
| Bir Amritpal S | $646,000 | -- |
Source: Public Records
Mortgage History
| Date | Status | Borrower | Loan Amount |
|---|---|---|---|
| Open | Dhillon Amandeep | $874,795 | |
| Previous Owner | Bir Amritpal S | $516,800 | |
| Closed | Bir Amritpal S | $129,200 |
Source: Public Records
Tax History Compared to Growth
Tax History
| Year | Tax Paid | Tax Assessment Tax Assessment Total Assessment is a certain percentage of the fair market value that is determined by local assessors to be the total taxable value of land and additions on the property. | Land | Improvement |
|---|---|---|---|---|
| 2025 | $7,748 | $40,204 | $11,872 | $28,332 |
| 2024 | $7,748 | $38,574 | $12,436 | $26,138 |
| 2023 | $7,696 | $38,315 | $11,147 | $27,168 |
| 2022 | $7,383 | $59,700 | $17,700 | $42,000 |
| 2021 | $7,359 | $53,820 | $17,700 | $36,120 |
| 2020 | $7,092 | $47,940 | $17,700 | $30,240 |
| 2019 | $6,724 | $41,040 | $17,700 | $23,340 |
| 2018 | $6,509 | $31,929 | $12,592 | $19,337 |
| 2017 | $6,283 | $30,820 | $13,026 | $17,794 |
| 2016 | $5,825 | $30,820 | $13,026 | $17,794 |
| 2015 | $3,287 | $27,919 | $14,308 | $13,611 |
| 2014 | $3,287 | $26,788 | $15,415 | $11,373 |
Source: Public Records
Map
Nearby Homes
- 23913 86th Ave
- 85-19 239th St
- 241-10 86th Ave
- 24134 87th Ave
- 8860 240th St
- 8918 239th St
- 24607 87th Ave
- 8933 238th St
- 24612 86th Rd
- 246-31 87th Ave
- 8922 Moline St
- 244-59 89th Ave
- 23727 Davenport Ave
- 246-59 86th Rd
- 88-19 247th St
- 87-01 Commonwealth Blvd
- 8808 Ransom St
- 8344 247th St
- 82-159 Country Pointe Cir
- 24432 90th Ave
- 8624 239th St
- 8624 239th St
- 8624 239th St Unit 2Fl
- 8624 239th St
- 8628 239th St
- 8628 239th St Unit 2nd Fl
- 8628 239th St
- 8620 239th St
- 8632 239th St
- 8616 239th St
- 8616 239th St
- 8612 239th St
- 8636 239th St
- 8608 239th St
- 8627 239th St
- 8623 239th St
- 86-20 239th St
- 86-31 239th St
- 8631 239th St
- 86-04 239th St Unit 2nd Fl