8626 Magnolia Dr Nederland, CO 80466
Estimated Value: $1,461,849 - $1,977,000
2
Beds
4
Baths
4,035
Sq Ft
$398/Sq Ft
Est. Value
About This Home
This home is located at 8626 Magnolia Dr, Nederland, CO 80466 and is currently estimated at $1,606,962, approximately $398 per square foot. 8626 Magnolia Dr is a home located in Boulder County with nearby schools including Nederland Elementary School and Nederland Middle-Senior High School.
Ownership History
Date
Name
Owned For
Owner Type
Purchase Details
Closed on
Jun 30, 2009
Sold by
Kuma Inu Trust B
Bought by
Bridgland Steven
Current Estimated Value
Home Financials for this Owner
Home Financials are based on the most recent Mortgage that was taken out on this home.
Original Mortgage
$305,000
Outstanding Balance
$83,937
Interest Rate
4.97%
Mortgage Type
Purchase Money Mortgage
Estimated Equity
$1,523,025
Purchase Details
Closed on
Sep 16, 2008
Sold by
Press Priscilla D and Estate Of Joel Ehrlich
Bought by
Kuma Inu Trust B
Purchase Details
Closed on
Jun 5, 1998
Sold by
Novack Robert and Southpac Trust International I
Bought by
Ehrlich Joel C
Purchase Details
Closed on
Sep 27, 1995
Sold by
Ehrlich Joel C
Bought by
Ehrlich Robert and Southpac Trust International Inc
Purchase Details
Closed on
Dec 15, 1978
Bought by
Bridgland Steven
Purchase Details
Closed on
May 17, 1974
Bought by
Bridgland Steven
Create a Home Valuation Report for This Property
The Home Valuation Report is an in-depth analysis detailing your home's value as well as a comparison with similar homes in the area
Home Values in the Area
Average Home Value in this Area
Purchase History
| Date | Buyer | Sale Price | Title Company |
|---|---|---|---|
| Bridgland Steven | $789,500 | Utc Colorado | |
| Kuma Inu Trust B | -- | None Available | |
| Ehrlich Joel C | -- | -- | |
| Ehrlich Robert | -- | -- | |
| Bridgland Steven | $80,000 | -- | |
| Bridgland Steven | -- | -- |
Source: Public Records
Mortgage History
| Date | Status | Borrower | Loan Amount |
|---|---|---|---|
| Open | Bridgland Steven | $305,000 |
Source: Public Records
Tax History Compared to Growth
Tax History
| Year | Tax Paid | Tax Assessment Tax Assessment Total Assessment is a certain percentage of the fair market value that is determined by local assessors to be the total taxable value of land and additions on the property. | Land | Improvement |
|---|---|---|---|---|
| 2025 | $8,546 | $90,544 | $12,444 | $78,100 |
| 2024 | $8,546 | $90,544 | $12,444 | $78,100 |
| 2023 | $8,391 | $98,101 | $17,085 | $84,701 |
| 2022 | $7,520 | $81,711 | $10,752 | $70,959 |
| 2021 | $7,420 | $84,061 | $11,061 | $73,000 |
| 2020 | $5,868 | $65,559 | $10,296 | $55,263 |
| 2019 | $5,775 | $65,559 | $10,296 | $55,263 |
| 2018 | $4,666 | $52,199 | $9,936 | $42,263 |
| 2017 | $4,542 | $63,187 | $10,985 | $52,202 |
| 2016 | $4,738 | $52,863 | $12,179 | $40,684 |
| 2015 | $4,498 | $65,216 | $36,138 | $29,078 |
| 2014 | $5,703 | $65,216 | $36,138 | $29,078 |
Source: Public Records
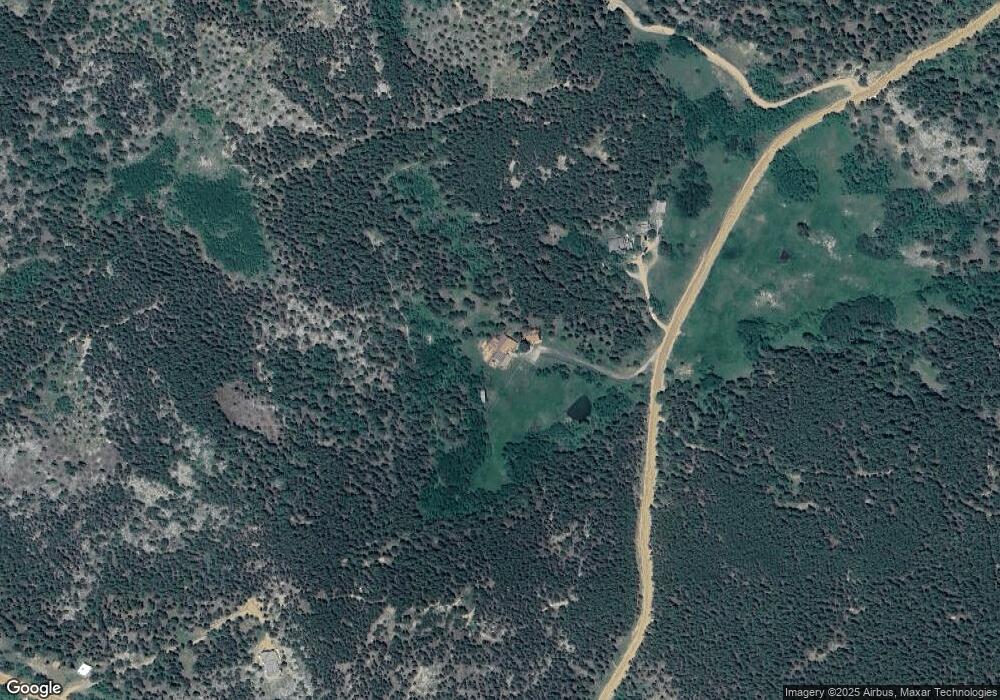
Map
Nearby Homes
- 1101 County Road 99
- 188 Ponderosa Way
- 7127 Highway 72
- 178 Hazelwood Dr
- 2200 Magnolia Rd
- 134 Hurricane Hill Dr
- 213 Rocky Knob Ln
- 54 Doe Trail
- 187 Rocky Knob Ln
- 3592 Ridge Rd
- 81 Doe Trail
- 3907 Ridge Rd
- 555 Forsythe Rd
- 1513 Ridge Rd
- 156 Shady Hollow
- 45 Alpine Dr
- 1001 Pactolus Lake Rd
- Lot 028 Sunflower Rd Unit 28
- 00 Sunflower Rd
- 582 Pactolus Lake Rd
- 8624 Magnolia Dr
- 9186 Magnolia Dr
- 9186 Magnolia Dr
- 0 Lazy Z Rd
- 157 Lazy Z Rd
- 159 Lazy Z Rd
- 364 Lazy Z Rd
- 8050 Magnolia Dr
- 57 Aspen Way
- 189 Aspen Way
- 322 County Road 97
- 30 Aspen Way
- 522 Lazy Z Rd
- 237 Aspen Way
- 0 Evergreen Way
- 7616 Magnolia Dr
- 71 Evergreen Way
- 465 Evergreen Way
- 356 Aspen Way
- 78 Evergreen Way