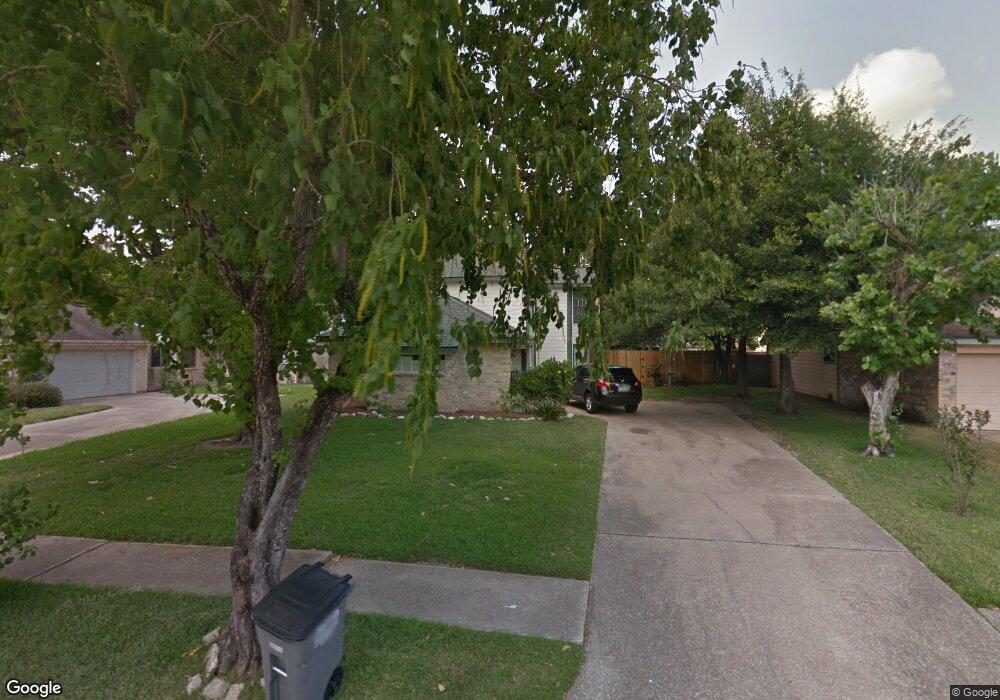
8626 Pine Falls Dr Houston, TX 77095
Copperfield NeighborhoodEstimated Value: $262,457 - $286,000
4
Beds
3
Baths
1,956
Sq Ft
$140/Sq Ft
Est. Value
About This Home
This home is located at 8626 Pine Falls Dr, Houston, TX 77095 and is currently estimated at $274,114, approximately $140 per square foot. 8626 Pine Falls Dr is a home located in Harris County with nearby schools including Fiest Elementary School, Labay Middle School, and Cypress Falls High School.
Ownership History
Date
Name
Owned For
Owner Type
Purchase Details
Closed on
Sep 4, 2015
Sold by
Barrios Nelson A and Barrios Elisa
Bought by
Rivera Mario and Rivera Ana H
Current Estimated Value
Home Financials for this Owner
Home Financials are based on the most recent Mortgage that was taken out on this home.
Original Mortgage
$109,000
Outstanding Balance
$86,106
Interest Rate
4.08%
Mortgage Type
New Conventional
Estimated Equity
$188,008
Purchase Details
Closed on
May 22, 2009
Sold by
Edwards Susan C and Mccann Garcia
Bought by
Barrios Nelson A
Home Financials for this Owner
Home Financials are based on the most recent Mortgage that was taken out on this home.
Original Mortgage
$112,327
Interest Rate
5.71%
Mortgage Type
FHA
Purchase Details
Closed on
Mar 17, 2003
Sold by
Garcia Pedro
Bought by
Garcia Susan Edwards
Create a Home Valuation Report for This Property
The Home Valuation Report is an in-depth analysis detailing your home's value as well as a comparison with similar homes in the area
Home Values in the Area
Average Home Value in this Area
Purchase History
| Date | Buyer | Sale Price | Title Company |
|---|---|---|---|
| Rivera Mario | -- | Great American Title | |
| Barrios Nelson A | -- | Alamo Title Company | |
| Garcia Susan Edwards | -- | -- |
Source: Public Records
Mortgage History
| Date | Status | Borrower | Loan Amount |
|---|---|---|---|
| Open | Rivera Mario | $109,000 | |
| Previous Owner | Barrios Nelson A | $112,327 | |
| Closed | Garcia Susan Edwards | $0 |
Source: Public Records
Tax History Compared to Growth
Tax History
| Year | Tax Paid | Tax Assessment Tax Assessment Total Assessment is a certain percentage of the fair market value that is determined by local assessors to be the total taxable value of land and additions on the property. | Land | Improvement |
|---|---|---|---|---|
| 2025 | $2,756 | $270,241 | $69,677 | $200,564 |
| 2024 | $2,756 | $230,758 | $60,588 | $170,170 |
| 2023 | $2,756 | $267,013 | $60,588 | $206,425 |
| 2022 | $4,146 | $240,879 | $48,470 | $192,409 |
| 2021 | $3,971 | $171,037 | $48,470 | $122,567 |
| 2020 | $4,369 | $183,199 | $40,392 | $142,807 |
| 2019 | $4,437 | $180,693 | $33,660 | $147,033 |
| 2018 | $1,523 | $163,430 | $33,660 | $129,770 |
| 2017 | $3,600 | $156,972 | $33,660 | $123,312 |
| 2016 | $3,600 | $156,972 | $33,660 | $123,312 |
| 2015 | $3,310 | $151,071 | $33,660 | $117,411 |
| 2014 | $3,310 | $137,764 | $26,255 | $111,509 |
Source: Public Records
Map
Nearby Homes
- 15954 Oak Mountain Dr
- 8306 Lake Crystal Dr
- 8550 Sparkling Springs Dr
- 8526 Greenleaf Lake Dr
- 15735 Jamie Lee Dr
- 8526 Hot Springs Dr
- 8818 Apple Mill Dr
- 16111 Aberdeen Forest Dr
- 8426 Laurel Trails Dr
- 16123 Aberdeen Forest Dr
- 8814 Sherina Park Dr
- 15802 Aberdeen Trails Dr
- 15906 Marwick Ct
- 15634 Haleys Landing Ln
- 8550 Waiting Spring Ln
- 15918 Pinyon Creek Dr
- 15610 Manorford Ct
- 15627 Kentwater Ct
- 15611 Meadow Village Dr
- 15610 Tarpon Springs Ct
- 8622 Pine Falls Dr
- 8630 Pine Falls Dr
- 8618 Pine Falls Dr
- 8634 Pine Falls Dr
- 8627 Pine Falls Dr
- 8631 Pine Falls Dr
- 8619 Pine Falls Dr
- 8614 Pine Falls Dr
- 8638 Pine Falls Dr
- 15859 Meadow Village Dr
- 15863 Meadow Village Dr
- 8635 Pine Falls Dr
- 15867 Meadow Village Dr
- 8615 Pine Falls Dr
- 15855 Meadow Village Dr
- 15871 Meadow Village Dr
- 15851 Meadow Village Dr
- 8642 Pine Falls Dr
- 8635 Timbercraft Dr
- 8611 Pine Falls Dr