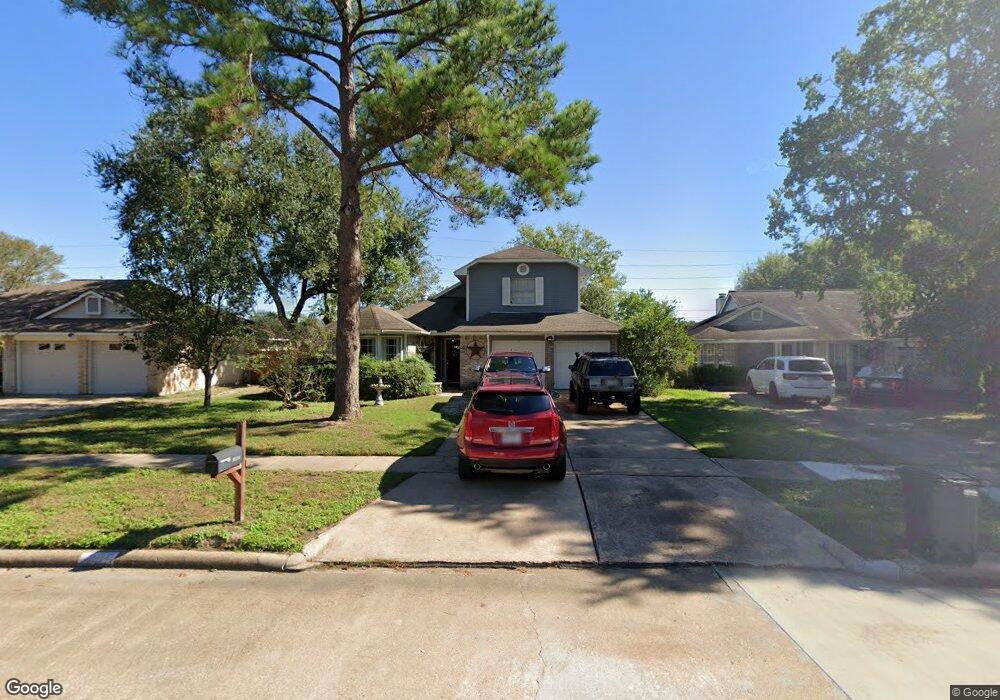
8626 Sunny Ridge Dr Houston, TX 77095
Estimated Value: $268,538 - $290,000
3
Beds
3
Baths
1,876
Sq Ft
$150/Sq Ft
Est. Value
About This Home
This home is located at 8626 Sunny Ridge Dr, Houston, TX 77095 and is currently estimated at $282,135, approximately $150 per square foot. 8626 Sunny Ridge Dr is a home located in Harris County with nearby schools including Fiest Elementary School, Labay Middle School, and Cypress Falls High School.
Ownership History
Date
Name
Owned For
Owner Type
Purchase Details
Closed on
Jun 6, 2000
Sold by
Lozoya Alejandro A and Lozoya Crystal Y
Bought by
Luckey John E and Luckey Jilda D
Current Estimated Value
Home Financials for this Owner
Home Financials are based on the most recent Mortgage that was taken out on this home.
Original Mortgage
$90,100
Interest Rate
8.66%
Purchase Details
Closed on
Jan 17, 1997
Sold by
Bank United
Bought by
Lozoya Alejandro A and Lozoya Crystal Y
Home Financials for this Owner
Home Financials are based on the most recent Mortgage that was taken out on this home.
Original Mortgage
$84,000
Interest Rate
7.57%
Purchase Details
Closed on
Jun 4, 1996
Sold by
Anderson Stephen J and Anderson Patricia L
Bought by
Bank United Of Texas Fsb
Create a Home Valuation Report for This Property
The Home Valuation Report is an in-depth analysis detailing your home's value as well as a comparison with similar homes in the area
Home Values in the Area
Average Home Value in this Area
Purchase History
| Date | Buyer | Sale Price | Title Company |
|---|---|---|---|
| Luckey John E | -- | American Title Co | |
| Lozoya Alejandro A | -- | Fidelity National Title | |
| Bank United Of Texas Fsb | $75,596 | -- |
Source: Public Records
Mortgage History
| Date | Status | Borrower | Loan Amount |
|---|---|---|---|
| Closed | Luckey John E | $90,100 | |
| Previous Owner | Lozoya Alejandro A | $84,000 | |
| Closed | Luckey John E | $82,000 |
Source: Public Records
Tax History Compared to Growth
Tax History
| Year | Tax Paid | Tax Assessment Tax Assessment Total Assessment is a certain percentage of the fair market value that is determined by local assessors to be the total taxable value of land and additions on the property. | Land | Improvement |
|---|---|---|---|---|
| 2025 | $1,162 | $273,501 | $69,956 | $203,545 |
| 2024 | $1,162 | $257,024 | $60,831 | $196,193 |
| 2023 | $1,162 | $270,327 | $60,831 | $209,496 |
| 2022 | $4,726 | $240,830 | $48,665 | $192,165 |
| 2021 | $4,526 | $194,948 | $48,665 | $146,283 |
| 2020 | $4,375 | $183,450 | $40,554 | $142,896 |
| 2019 | $4,446 | $180,930 | $33,795 | $147,135 |
| 2018 | $1,527 | $163,771 | $33,795 | $129,976 |
| 2017 | $3,608 | $157,300 | $33,795 | $123,505 |
| 2016 | $3,608 | $157,300 | $33,795 | $123,505 |
| 2015 | $2,508 | $151,388 | $33,795 | $117,593 |
| 2014 | $2,508 | $138,155 | $26,360 | $111,795 |
Source: Public Records
Map
Nearby Homes
- 15634 Haleys Landing Ln
- 15610 Tarpon Springs Ct
- 15610 Manorford Ct
- 15627 Kentwater Ct
- 8526 Greenleaf Lake Dr
- 15735 Jamie Lee Dr
- 9303 Reston Grove Ln
- 15414 Swan Creek Dr
- 15611 Meadow Village Dr
- 15415 Swan Creek Dr
- 15802 Aberdeen Trails Dr
- 15362 Meadow Village Dr
- 9111 Sunny Ridge Dr
- 9111 Baber Dr
- 9119 Baber Dr
- 15314 Tysor Park Ln
- 9303 Rush Mill Ct
- 9138 Shango Ln
- 15407 Copper Branch Ln
- 9307 Rush Mill Ct
- 8630 Sunny Ridge Dr
- 8622 Sunny Ridge Dr
- 8634 Sunny Ridge Dr
- 8618 Sunny Ridge Dr
- 8623 Sunny Ridge Dr
- 8627 Sunny Ridge Dr
- 8638 Sunny Ridge Dr
- 8614 Sunny Ridge Dr
- 8619 Sunny Ridge Dr
- 8635 Sunny Ridge Dr
- 8615 Sunny Ridge Dr
- 8639 Sunny Ridge Dr
- 8610 Sunny Ridge Dr
- 8927 Canton Park Ln
- 8618 Lake Crystal Dr
- 8923 Canton Park Ln
- 8919 Canton Park Ln
- 8614 Lake Crystal Dr
- 8931 Canton Park Ln
- 8643 Sunny Ridge Dr