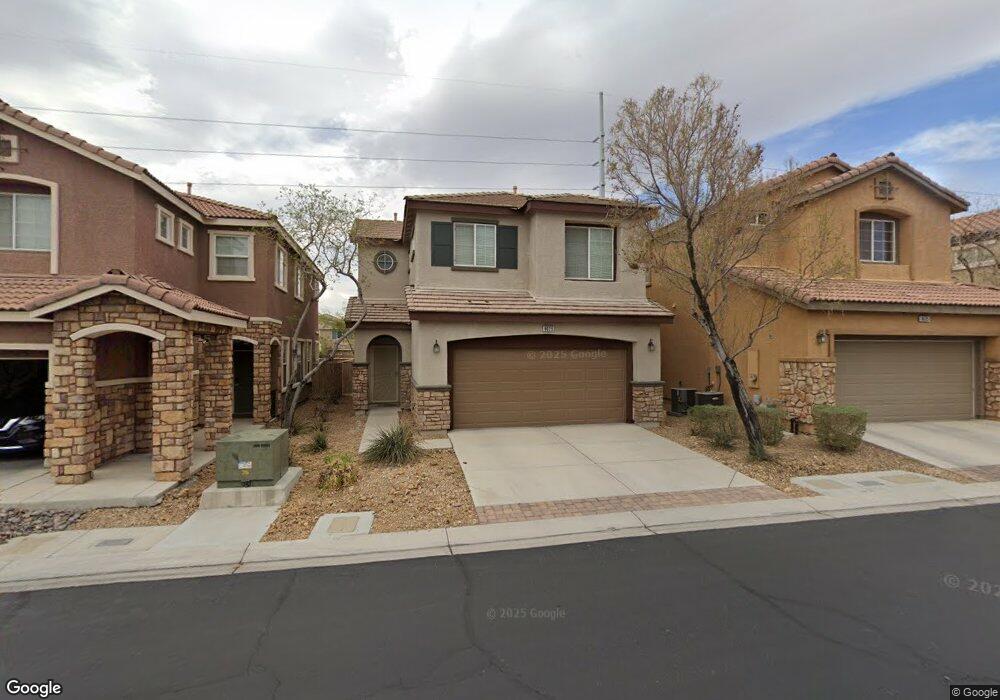
8629 Canfield Canyon Ave Las Vegas, NV 89178
Mountains Edge NeighborhoodEstimated Value: $390,000 - $416,000
3
Beds
3
Baths
1,481
Sq Ft
$271/Sq Ft
Est. Value
About This Home
This home is located at 8629 Canfield Canyon Ave, Las Vegas, NV 89178 and is currently estimated at $400,832, approximately $270 per square foot. 8629 Canfield Canyon Ave is a home located in Clark County with nearby schools including Desert Oasis High School, Doral Academy Cactus, and Good Samaritan Christian Academy.
Ownership History
Date
Name
Owned For
Owner Type
Purchase Details
Closed on
Dec 16, 2009
Sold by
Enetprice Inc
Bought by
Robison Carla
Current Estimated Value
Home Financials for this Owner
Home Financials are based on the most recent Mortgage that was taken out on this home.
Original Mortgage
$100,000
Outstanding Balance
$65,259
Interest Rate
4.91%
Mortgage Type
New Conventional
Estimated Equity
$335,573
Purchase Details
Closed on
Sep 14, 2009
Sold by
Nowlin Daniel J and Loman Melissa L
Bought by
Enetprice Inc
Purchase Details
Closed on
Jun 20, 2007
Sold by
Nowlin Daniel J and Loman Melissa L
Bought by
Loman Melissa L
Purchase Details
Closed on
Aug 15, 2006
Sold by
Mme Llc
Bought by
Nowlin Daniel J and Loman Melissa L
Home Financials for this Owner
Home Financials are based on the most recent Mortgage that was taken out on this home.
Original Mortgage
$242,176
Interest Rate
7%
Mortgage Type
Unknown
Create a Home Valuation Report for This Property
The Home Valuation Report is an in-depth analysis detailing your home's value as well as a comparison with similar homes in the area
Home Values in the Area
Average Home Value in this Area
Purchase History
| Date | Buyer | Sale Price | Title Company |
|---|---|---|---|
| Robison Carla | $132,000 | First American Title Paseo | |
| Enetprice Inc | $93,000 | None Available | |
| Loman Melissa L | -- | None Available | |
| Nowlin Daniel J | $296,480 | Land Title Of Nevada |
Source: Public Records
Mortgage History
| Date | Status | Borrower | Loan Amount |
|---|---|---|---|
| Open | Robison Carla | $100,000 | |
| Previous Owner | Nowlin Daniel J | $242,176 |
Source: Public Records
Tax History Compared to Growth
Tax History
| Year | Tax Paid | Tax Assessment Tax Assessment Total Assessment is a certain percentage of the fair market value that is determined by local assessors to be the total taxable value of land and additions on the property. | Land | Improvement |
|---|---|---|---|---|
| 2025 | $2,071 | $103,390 | $33,250 | $70,140 |
| 2024 | $1,918 | $103,390 | $33,250 | $70,140 |
| 2023 | $1,277 | $97,394 | $31,500 | $65,894 |
| 2022 | $1,777 | $86,321 | $26,250 | $60,071 |
| 2021 | $1,645 | $81,550 | $24,500 | $57,050 |
| 2020 | $1,525 | $80,957 | $24,500 | $56,457 |
| 2019 | $1,429 | $77,430 | $22,050 | $55,380 |
| 2018 | $1,363 | $66,892 | $17,500 | $49,392 |
| 2017 | $1,880 | $64,113 | $15,750 | $48,363 |
| 2016 | $1,277 | $60,257 | $15,750 | $44,507 |
| 2015 | $1,274 | $49,706 | $12,250 | $37,456 |
| 2014 | $1,237 | $44,370 | $5,250 | $39,120 |
Source: Public Records
Map
Nearby Homes
- 8695 Canfield Canyon Ave
- 10220 Cougar Crossing St
- 10208 Arch Bluff St
- 8749 Brilliant Star Dr
- 8708 Gateway Glen Dr
- 8768 Charm Canyon Ave
- 10320 Bluff Valley Ct Unit 2
- 8733 Autumn Teal Ave
- 8626 Anderson Dale Ave
- 10395 Kern Ridge St
- 10330 Eve Springs St
- 10368 Saddle Mountain St
- 8547 Benidorm Ave
- 9864 Maspalomas St
- 8719 Mount Mira Loma Ave
- 8347 Campbell Springs Ave
- 7680 Pirouette Ave
- 7711 Pirouette Ave
- 7651 Pirouette Ave
- 7661 Pirouette Ave
- 8623 Canfield Canyon Ave
- 8635 Canfield Canyon Ave
- 8617 Canfield Canyon Ave
- 8641 Canfield Canyon Ave
- 8611 Canfield Canyon Ave
- 8647 Canfield Canyon Ave
- 10067 Blair Rock St
- 10066 Fancy Flight St
- 8653 Canfield Canyon Ave
- 10061 Blair Rock St
- 8617 Splendid Leaf Ct
- 8607 Canfield Canyon Ave
- 10060 Fancy Flight St
- 8659 Canfield Canyon Ave
- 8611 Splendid Leaf Ct
- 10055 Blair Rock St
- 10054 Fancy Flight St
- 8644 Abbey Dell Ave
- 8638 Abbey Dell Ave
- 8665 Canfield Canyon Ave Unit n/a