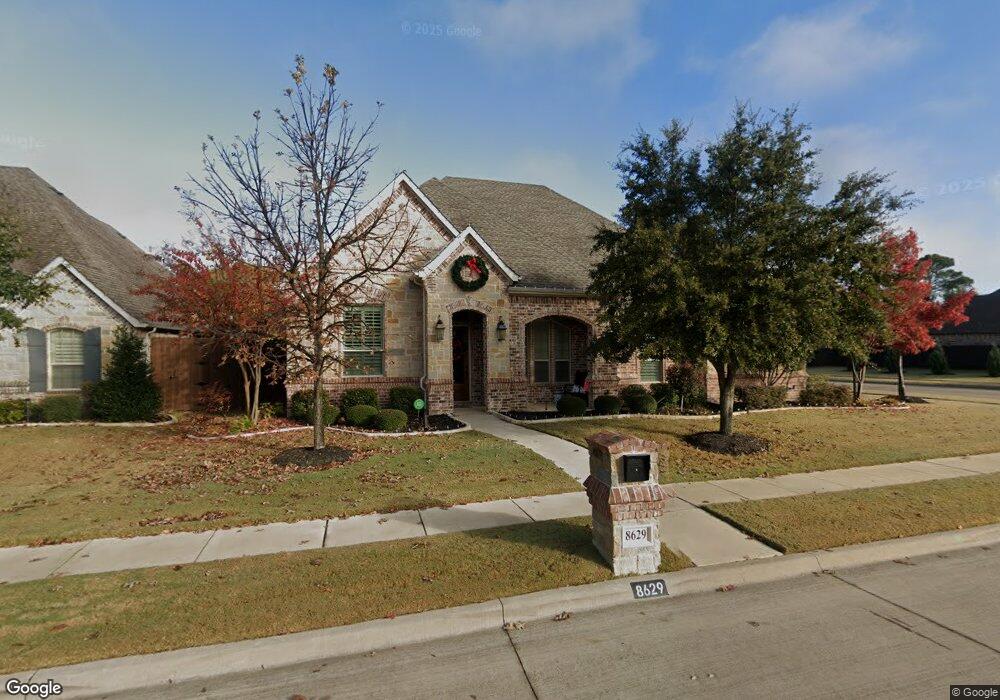
8629 Shadywood Ln North Richland Hills, TX 76182
Estimated Value: $678,840 - $747,000
3
Beds
3
Baths
3,000
Sq Ft
$241/Sq Ft
Est. Value
About This Home
This home is located at 8629 Shadywood Ln, North Richland Hills, TX 76182 and is currently estimated at $721,960, approximately $240 per square foot. 8629 Shadywood Ln is a home with nearby schools including Smithfield Elementary School, Smithfield Middle School, and Birdville High School.
Ownership History
Date
Name
Owned For
Owner Type
Purchase Details
Closed on
Nov 2, 2020
Sold by
Gray Gregory E and Gray Dena B
Bought by
Liles Randell S and Liles Jana T
Current Estimated Value
Home Financials for this Owner
Home Financials are based on the most recent Mortgage that was taken out on this home.
Original Mortgage
$435,200
Outstanding Balance
$386,211
Interest Rate
2.9%
Mortgage Type
New Conventional
Estimated Equity
$335,749
Purchase Details
Closed on
Feb 27, 2015
Sold by
Dustin Austin Enterprises Inc
Bought by
Gray Gregory E and Gray Dena B
Purchase Details
Closed on
Jul 21, 2001
Sold by
J & J Nrh 100 Flp
Bought by
Dustin Austin Enterprises Inc
Home Financials for this Owner
Home Financials are based on the most recent Mortgage that was taken out on this home.
Original Mortgage
$338,400
Interest Rate
4.17%
Mortgage Type
Purchase Money Mortgage
Create a Home Valuation Report for This Property
The Home Valuation Report is an in-depth analysis detailing your home's value as well as a comparison with similar homes in the area
Home Values in the Area
Average Home Value in this Area
Purchase History
| Date | Buyer | Sale Price | Title Company |
|---|---|---|---|
| Liles Randell S | -- | New Title Company Name | |
| Gray Gregory E | -- | None Available | |
| Dustin Austin Enterprises Inc | -- | None Available |
Source: Public Records
Mortgage History
| Date | Status | Borrower | Loan Amount |
|---|---|---|---|
| Open | Liles Randell S | $435,200 | |
| Previous Owner | Dustin Austin Enterprises Inc | $338,400 |
Source: Public Records
Tax History Compared to Growth
Tax History
| Year | Tax Paid | Tax Assessment Tax Assessment Total Assessment is a certain percentage of the fair market value that is determined by local assessors to be the total taxable value of land and additions on the property. | Land | Improvement |
|---|---|---|---|---|
| 2025 | $6,031 | $648,330 | $99,238 | $549,092 |
| 2024 | $6,031 | $648,330 | $99,238 | $549,092 |
| 2023 | $11,207 | $690,421 | $99,238 | $591,183 |
| 2022 | $11,176 | $464,422 | $99,238 | $365,184 |
| 2021 | $11,497 | $451,832 | $85,000 | $366,832 |
| 2020 | $11,375 | $447,024 | $85,000 | $362,024 |
| 2019 | $11,684 | $443,691 | $80,750 | $362,941 |
| 2018 | $10,810 | $438,938 | $80,750 | $358,188 |
| 2017 | $12,497 | $471,449 | $85,000 | $386,449 |
| 2016 | $11,361 | $422,269 | $115,000 | $307,269 |
| 2015 | $1,193 | $200,051 | $48,000 | $152,051 |
| 2014 | $1,193 | $60,000 | $60,000 | $0 |
Source: Public Records
Map
Nearby Homes
- 8200 Thornhill Dr
- 8932 Thornberry Dr
- 8312 Thornway Ct
- 8229 Forest Glenn
- 8316 Westwind Ln
- 8381 Davis Blvd Unit 208
- 7905 Hallmark Dr
- 8600 Foxwood Dr
- 8324 Flat Rock Ct
- 7924 Woodland Dr
- 7908 Hallmark Dr
- 8315 Thornridge Dr
- 8113 Biscayne Ct
- 8205 Edgemont Ct
- 7924 Ember Oaks Dr
- 8048 Green Valley Dr
- 8428 Hidden Creek Ct
- 9216 Cachelle Ct
- 8133 Pecan Ridge Dr
- TBD Kirk Ln
- 8625 Shadywood Ln
- 8632 Timber Dr
- 8701 Shadywood Ln
- 8621 Shadywood Ln
- 8624 Shadywood Ln
- 8628 Shadywood Ln
- 8620 Shadywood Ln
- 8628 Timber Dr
- 8628 Timber Dr
- 8700 Shadywood Ln
- 8633 Timber Dr
- 8617 Shadywood Ln
- 8705 Shadywood Ln
- 8629 Timber Dr
- 8704 Shadywood Ln
- 8613 Shadywood Ln
- 8637 Timber Dr
- 8624 Timber Dr
- 8708 Shadywood Ln
- 8709 Shadywood Ln