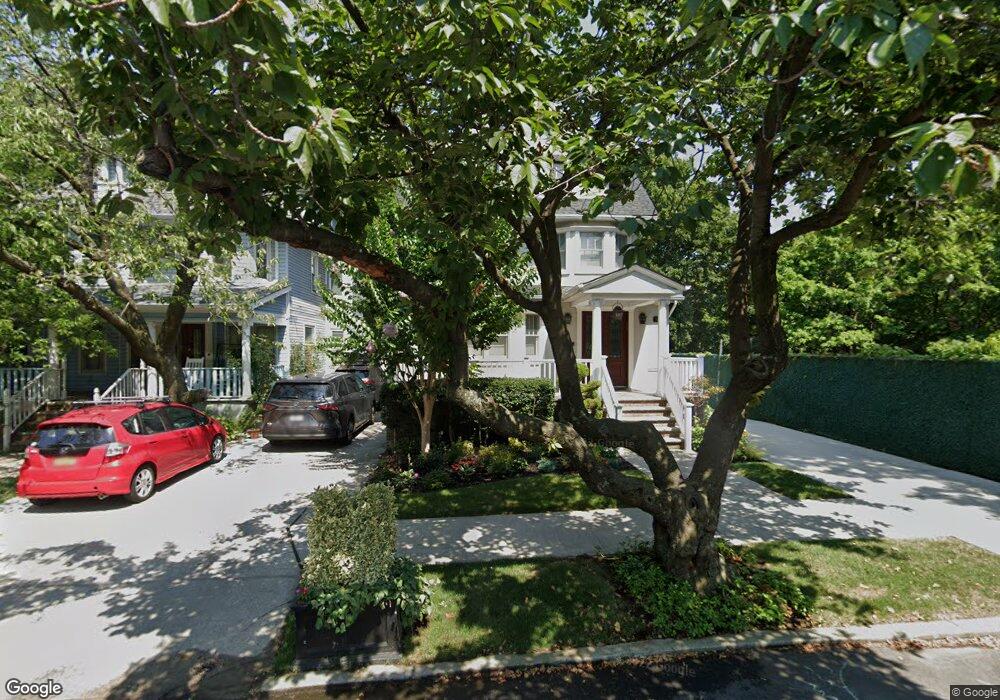
863 E 17th St Brooklyn, NY 11230
Ditmas Park NeighborhoodEstimated Value: $1,737,000 - $2,063,000
Studio
--
Bath
2,944
Sq Ft
$632/Sq Ft
Est. Value
About This Home
This home is located at 863 E 17th St, Brooklyn, NY 11230 and is currently estimated at $1,860,570, approximately $631 per square foot. 863 E 17th St is a home located in Kings County with nearby schools including School of Science and Technology, P.S. 315, and Jhs 234 Arthur W Cunningham.
Ownership History
Date
Name
Owned For
Owner Type
Purchase Details
Closed on
Jun 20, 2005
Sold by
Corser John B and Figueroa Lourdes M
Bought by
Rose Joseph and Rose Sara Leah
Current Estimated Value
Home Financials for this Owner
Home Financials are based on the most recent Mortgage that was taken out on this home.
Original Mortgage
$359,650
Outstanding Balance
$184,992
Interest Rate
5.73%
Mortgage Type
Purchase Money Mortgage
Estimated Equity
$1,675,578
Purchase Details
Closed on
Aug 25, 1999
Sold by
Christopher Joanne
Bought by
Corser John B and Figueroa Lourdes M
Home Financials for this Owner
Home Financials are based on the most recent Mortgage that was taken out on this home.
Original Mortgage
$356,250
Interest Rate
7.5%
Purchase Details
Closed on
Nov 20, 1995
Sold by
Huggins Ferosa
Bought by
Christopher Joanne
Home Financials for this Owner
Home Financials are based on the most recent Mortgage that was taken out on this home.
Original Mortgage
$179,200
Interest Rate
7.33%
Create a Home Valuation Report for This Property
The Home Valuation Report is an in-depth analysis detailing your home's value as well as a comparison with similar homes in the area
Home Values in the Area
Average Home Value in this Area
Purchase History
| Date | Buyer | Sale Price | Title Company |
|---|---|---|---|
| Rose Joseph | $530,000 | -- | |
| Rose Joseph | $530,000 | -- | |
| Corser John B | $375,000 | First American Title Ins Co | |
| Corser John B | $375,000 | First American Title Ins Co | |
| Christopher Joanne | $224,000 | -- | |
| Christopher Joanne | -- | -- |
Source: Public Records
Mortgage History
| Date | Status | Borrower | Loan Amount |
|---|---|---|---|
| Open | Rose Joseph | $359,650 | |
| Closed | Rose Joseph | $359,650 | |
| Previous Owner | Corser John B | $356,250 | |
| Previous Owner | Christopher Joanne | $179,200 |
Source: Public Records
Tax History
| Year | Tax Paid | Tax Assessment Tax Assessment Total Assessment is a certain percentage of the fair market value that is determined by local assessors to be the total taxable value of land and additions on the property. | Land | Improvement |
|---|---|---|---|---|
| 2025 | $12,774 | $97,860 | $38,940 | $58,920 |
| 2024 | $12,774 | $106,680 | $38,940 | $67,740 |
| 2023 | $12,518 | $120,240 | $38,940 | $81,300 |
| 2022 | $11,585 | $97,980 | $38,940 | $59,040 |
| 2021 | $11,646 | $105,240 | $38,940 | $66,300 |
| 2020 | $2,859 | $111,900 | $38,940 | $72,960 |
| 2019 | $11,038 | $104,460 | $38,940 | $65,520 |
| 2018 | $10,411 | $52,530 | $20,851 | $31,679 |
| 2017 | $9,803 | $49,557 | $24,990 | $24,567 |
| 2016 | $9,143 | $47,286 | $26,896 | $20,390 |
| 2015 | $5,639 | $47,277 | $40,339 | $6,938 |
| 2014 | $5,639 | $45,139 | $34,150 | $10,989 |
Source: Public Records
Map
Nearby Homes
- 915 E 17th St Unit 214
- 915 E 17th St Unit 316
- 915 E 17th St Unit 114
- 920 E 17th St Unit 609
- 1615 Avenue I Unit 511
- 1615 Avenue I Unit 102
- 870 E 16th St Unit 4
- 1710 Ave H Unit F6
- 1710 Avenue H Unit F3
- 1620 Avenue I Unit 307
- 1620 Avenue I Unit 502
- 839 E 19th St Unit 4D
- 1375 Ocean Ave Unit 5J
- 1414 Avenue H
- 941 E 15th St
- 945 E 15th St
- 1401 Ocean Ave Unit 12B
- 1401 Ocean Ave Unit 11A
- 950 E 15th St
- 27 Wellington Ct
- 859 E 17th St
- 859 E 17th St Unit Building
- 853 E 17th St
- 849 E 17th St
- 856 E 18th St
- 862 E 17th St Unit 3
- 862 E 17th St Unit 9
- 862 E 17th St Unit B
- 862 E 17th St Unit C1
- 862 E 17th St Unit C2
- 862 E 17th St Unit A1
- 862 E 17th St Unit 15
- 862 E 17th St Unit C-4
- 860 E 17th St
- 843 E 17th St Unit 2
- 1704 Avenue H
- 1710 Ave H Unit D3
- 1710 Ave H Unit F 1
- 1710 Ave H Unit D 3
- 1710 Ave H Unit D 6
Your Personal Tour Guide
Ask me questions while you tour the home.