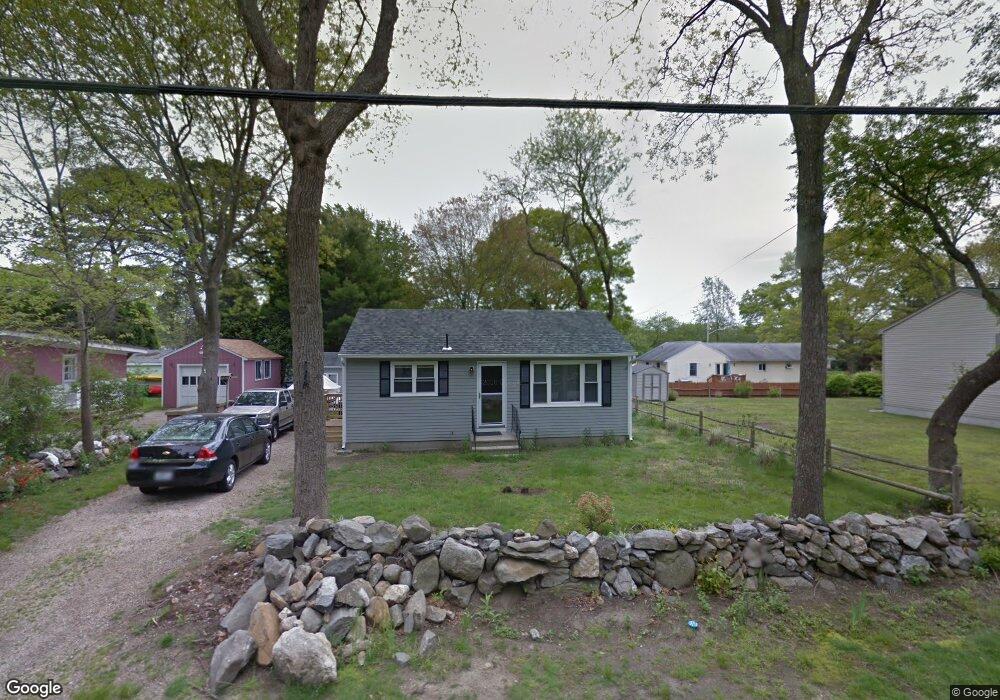
863 Middlebridge Rd Wakefield, RI 02879
Estimated Value: $450,000 - $524,000
2
Beds
1
Bath
768
Sq Ft
$630/Sq Ft
Est. Value
About This Home
This home is located at 863 Middlebridge Rd, Wakefield, RI 02879 and is currently estimated at $484,191, approximately $630 per square foot. 863 Middlebridge Rd is a home located in Washington County with nearby schools including South Kingstown High School, Quest Montessori School, and Monsignor Matthew Clarke Catholic Regional School.
Ownership History
Date
Name
Owned For
Owner Type
Purchase Details
Closed on
Aug 29, 2017
Sold by
Mattiucci Brian H
Bought by
Mattiucci Brian H and Mattiucci Karin M
Current Estimated Value
Home Financials for this Owner
Home Financials are based on the most recent Mortgage that was taken out on this home.
Original Mortgage
$115,000
Outstanding Balance
$77,500
Interest Rate
4.03%
Mortgage Type
Unknown
Estimated Equity
$406,691
Purchase Details
Closed on
Jul 13, 2017
Sold by
Mattiucci Sandra D
Bought by
Mattiucci Brian H
Home Financials for this Owner
Home Financials are based on the most recent Mortgage that was taken out on this home.
Original Mortgage
$115,000
Outstanding Balance
$77,500
Interest Rate
4.03%
Mortgage Type
Unknown
Estimated Equity
$406,691
Purchase Details
Closed on
Feb 12, 2014
Sold by
Mattiucci James J and Mattiucci Sandra D
Bought by
Sandra D Mattiucci T
Purchase Details
Closed on
Jan 3, 1986
Bought by
Sandra D Mattiucci T
Create a Home Valuation Report for This Property
The Home Valuation Report is an in-depth analysis detailing your home's value as well as a comparison with similar homes in the area
Home Values in the Area
Average Home Value in this Area
Purchase History
| Date | Buyer | Sale Price | Title Company |
|---|---|---|---|
| Mattiucci Brian H | -- | -- | |
| Mattiucci Brian H | -- | -- | |
| Mattiucci Sandra D | -- | -- | |
| Sandra D Mattiucci T | -- | -- | |
| Sandra D Mattiucci T | -- | -- |
Source: Public Records
Mortgage History
| Date | Status | Borrower | Loan Amount |
|---|---|---|---|
| Open | Sandra D Mattiucci T | $115,000 | |
| Previous Owner | Sandra D Mattiucci T | $20,000 |
Source: Public Records
Tax History
| Year | Tax Paid | Tax Assessment Tax Assessment Total Assessment is a certain percentage of the fair market value that is determined by local assessors to be the total taxable value of land and additions on the property. | Land | Improvement |
|---|---|---|---|---|
| 2025 | $2,872 | $321,200 | $156,700 | $164,500 |
| 2024 | $2,747 | $248,600 | $120,500 | $128,100 |
| 2023 | $2,747 | $248,600 | $120,500 | $128,100 |
| 2022 | $2,722 | $248,600 | $120,500 | $128,100 |
| 2021 | $2,822 | $195,300 | $104,800 | $90,500 |
| 2020 | $2,822 | $195,300 | $104,800 | $90,500 |
| 2019 | $2,822 | $195,300 | $104,800 | $90,500 |
| 2018 | $2,736 | $174,500 | $97,500 | $77,000 |
| 2017 | $2,672 | $174,500 | $97,500 | $77,000 |
| 2016 | $2,633 | $174,500 | $97,500 | $77,000 |
| 2015 | $2,708 | $174,500 | $95,300 | $79,200 |
| 2014 | $2,701 | $174,500 | $95,300 | $79,200 |
Source: Public Records
Map
Nearby Homes
- 125 Montauk Rd
- 5 Wayland Trail
- 36 Sachem Rd
- 416 Bridgetown Rd
- 54 Isabelle Dr
- 63 Sassafras Trail
- 30 Crest Ave
- 0 Indian Run Trail Unit 1403300
- 844 Boston Neck Rd
- 1029 Boston Neck Rd Unit 2
- 12 Park Ave Unit 13
- 0 Indian Trail Trail S Unit 1389828
- 51 Bonnet Shores Rd
- 53 Bonnet Shores Rd
- 55 Bonnet Shores Rd
- 727 Boston Neck Rd
- 137 Bonnet Shores Rd
- 175 Bonnet Point Rd Unit B 44
- 175 Bonnet Point Rd Unit 29
- 106 Pettaquamscutt Lake Rd
- 873 Middlebridge Rd
- 853 Middlebridge Rd
- 126 Riverside Dr
- 132 Riverside Dr
- 116 Riverside Dr
- 116 Riverside Dr
- 138 Riverside Dr
- 885 Middlebridge Rd
- 18 Shadbush Trail
- 864 Middlebridge Rd
- 17 Shadbush Trail
- 854 Middlebridge Rd
- 104 Riverside Dr
- 104 Riverside Dr
- 144 Riverside Dr
- 876 Middlebridge Rd
- 846 Middlebridge Rd
- 129 Riverside Dr
- 833 Middlebridge Rd
- 98 Riverside Dr
Your Personal Tour Guide
Ask me questions while you tour the home.