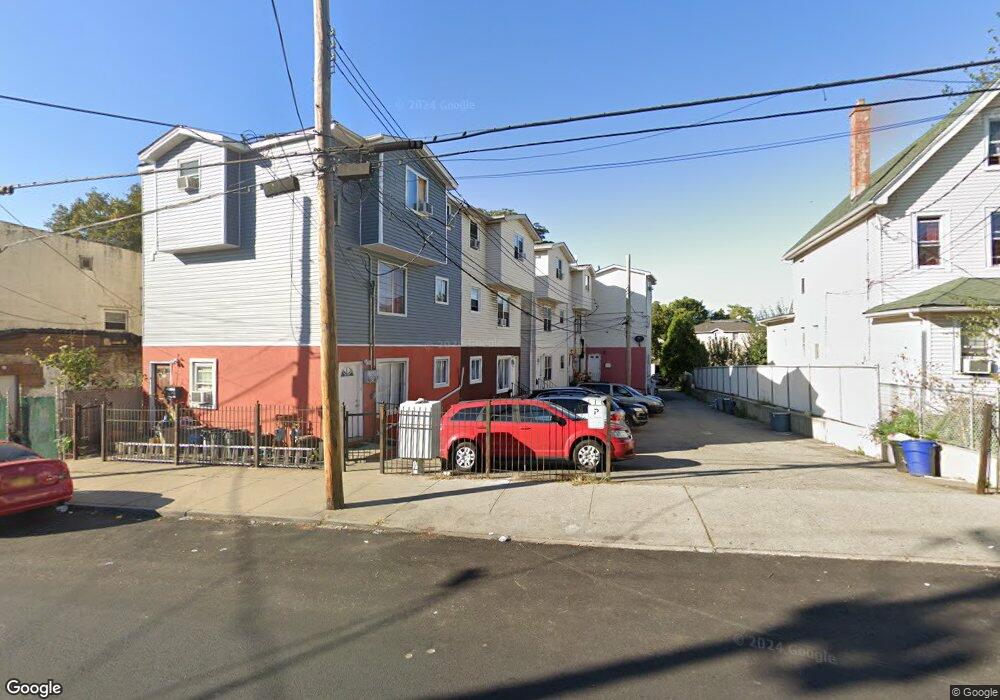
863 Post Ave Staten Island, NY 10310
West Brighton NeighborhoodEstimated Value: $578,132 - $638,000
6
Beds
2
Baths
1,800
Sq Ft
$341/Sq Ft
Est. Value
About This Home
This home is located at 863 Post Ave, Staten Island, NY 10310 and is currently estimated at $613,533, approximately $340 per square foot. 863 Post Ave is a home located in Richmond County with nearby schools including P.S. 19 The Curtis School, Intermediate School 27, and Susan E Wagner High School.
Ownership History
Date
Name
Owned For
Owner Type
Purchase Details
Closed on
Jun 15, 2018
Sold by
Grinberg Managment & Development Llc
Bought by
Wealth Mgmt Si Llc
Current Estimated Value
Purchase Details
Closed on
Sep 16, 2016
Sold by
Hsbc Bank Usa National Association
Bought by
Grinberg Management & Development Llc
Home Financials for this Owner
Home Financials are based on the most recent Mortgage that was taken out on this home.
Original Mortgage
$280,000
Interest Rate
3.5%
Mortgage Type
Stand Alone First
Purchase Details
Closed on
May 19, 2016
Sold by
Barreto Jose and Fremont Investment & Loan
Bought by
Hsbc Bank Usa National Association
Purchase Details
Closed on
Mar 29, 2006
Sold by
Sterling Equities Llc
Bought by
Barreto Jose
Home Financials for this Owner
Home Financials are based on the most recent Mortgage that was taken out on this home.
Original Mortgage
$304,800
Interest Rate
7.5%
Mortgage Type
Fannie Mae Freddie Mac
Create a Home Valuation Report for This Property
The Home Valuation Report is an in-depth analysis detailing your home's value as well as a comparison with similar homes in the area
Home Values in the Area
Average Home Value in this Area
Purchase History
| Date | Buyer | Sale Price | Title Company |
|---|---|---|---|
| Wealth Mgmt Si Llc | -- | Forest Abstract Co | |
| Grinberg Management & Development Llc | $173,394 | Commonwealth Land Title Ins | |
| Hsbc Bank Usa National Association | $1,000 | Webtitle Agency | |
| Barreto Jose | $381,000 | Fidelity Natl Title Ins Co |
Source: Public Records
Mortgage History
| Date | Status | Borrower | Loan Amount |
|---|---|---|---|
| Previous Owner | Grinberg Management & Development Llc | $280,000 | |
| Previous Owner | Barreto Jose | $304,800 |
Source: Public Records
Tax History Compared to Growth
Tax History
| Year | Tax Paid | Tax Assessment Tax Assessment Total Assessment is a certain percentage of the fair market value that is determined by local assessors to be the total taxable value of land and additions on the property. | Land | Improvement |
|---|---|---|---|---|
| 2025 | $4,408 | $32,400 | $3,403 | $28,997 |
| 2024 | $4,408 | $32,880 | $3,164 | $29,716 |
| 2023 | $4,457 | $21,946 | $2,934 | $19,012 |
| 2022 | $4,260 | $28,980 | $4,740 | $24,240 |
| 2021 | $4,324 | $24,000 | $4,740 | $19,260 |
| 2020 | $4,116 | $24,660 | $4,740 | $19,920 |
| 2019 | $3,839 | $21,900 | $4,740 | $17,160 |
| 2018 | $3,728 | $18,288 | $4,675 | $13,613 |
| 2017 | $1,848 | $17,784 | $4,637 | $13,147 |
| 2016 | $3,423 | $17,123 | $4,464 | $12,659 |
| 2015 | $2,925 | $16,154 | $3,754 | $12,400 |
| 2014 | $2,925 | $15,240 | $3,960 | $11,280 |
Source: Public Records
Map
Nearby Homes
- 859 Post Ave
- 286 Jewett Ave
- 1418 Castleton Ave
- 1422 Castleton Ave
- 25 Lexington Ave
- 322 Jewett Ave
- 28 Lexington Ave
- 30 Decker Ave
- 61 Greenleaf Ave
- 83 Palmer Ave
- 722 Post Ave
- 88 Jewett Ave
- 371 Jewett Ave
- 21 Dryden Ct
- 62 Lyceum Ct
- 886 Delafield Ave
- 176 Dubois Ave
- 109 Lyceum Ct
- 837 Delafield Ave Unit A
- 125 Decker Ave