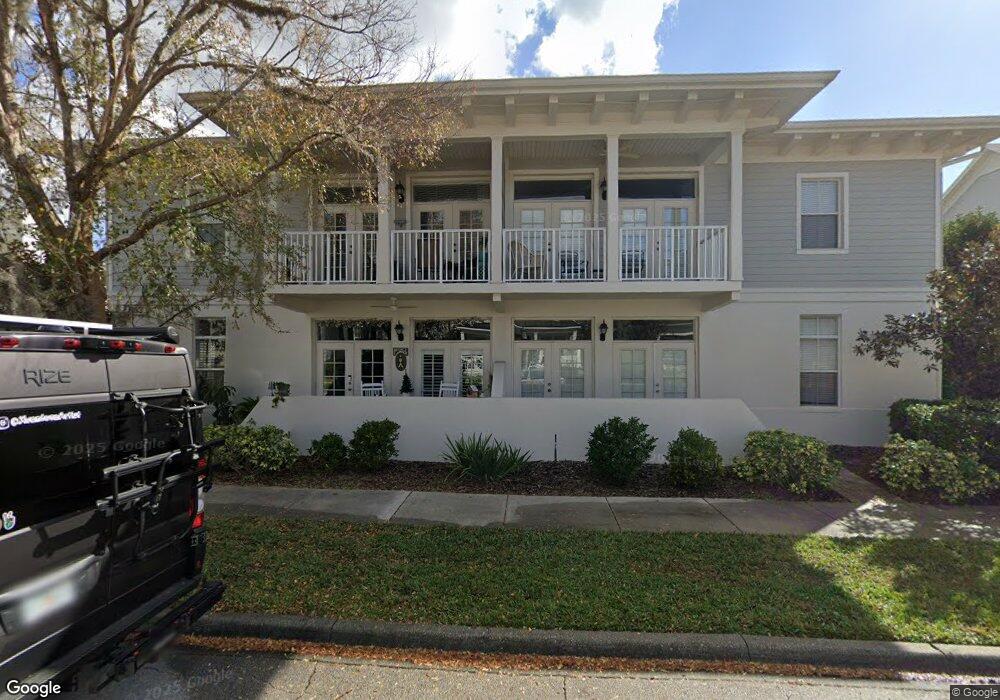
863 Spring Park Loop Unit 202 Celebration, FL 34747
Estimated Value: $461,965 - $562,000
3
Beds
2
Baths
1,469
Sq Ft
$338/Sq Ft
Est. Value
About This Home
This home is located at 863 Spring Park Loop Unit 202, Celebration, FL 34747 and is currently estimated at $496,991, approximately $338 per square foot. 863 Spring Park Loop Unit 202 is a home located in Osceola County with nearby schools including Celebration School, Celebration High School, and Montessori School Of Celebration.
Ownership History
Date
Name
Owned For
Owner Type
Purchase Details
Closed on
Nov 26, 2013
Sold by
Middleton David W and Middleton Kimberly J
Bought by
Declaration Middleton David W and David W Middleton Declaration Of Trust
Current Estimated Value
Purchase Details
Closed on
Oct 12, 2009
Sold by
Frieze Stephen and Frieze Elizabeth
Bought by
Middleton David W and Middleton Kimberly J
Purchase Details
Closed on
Aug 6, 2004
Sold by
Busso Andrew J and Busso Melissa A
Bought by
Frieze Stephen and Frieze Elizabeth
Purchase Details
Closed on
Oct 31, 2003
Sold by
Oriole Homes Corp
Bought by
Busso Andrew J and Busso Melissa A
Home Financials for this Owner
Home Financials are based on the most recent Mortgage that was taken out on this home.
Original Mortgage
$142,000
Interest Rate
5.93%
Mortgage Type
Purchase Money Mortgage
Create a Home Valuation Report for This Property
The Home Valuation Report is an in-depth analysis detailing your home's value as well as a comparison with similar homes in the area
Home Values in the Area
Average Home Value in this Area
Purchase History
| Date | Buyer | Sale Price | Title Company |
|---|---|---|---|
| Declaration Middleton David W | -- | Attorney | |
| Middleton David W | $217,000 | Attorney | |
| Frieze Stephen | $278,900 | Equitable Title Agency Inc | |
| Busso Andrew J | $214,500 | -- |
Source: Public Records
Mortgage History
| Date | Status | Borrower | Loan Amount |
|---|---|---|---|
| Previous Owner | Busso Andrew J | $142,000 |
Source: Public Records
Tax History
| Year | Tax Paid | Tax Assessment Tax Assessment Total Assessment is a certain percentage of the fair market value that is determined by local assessors to be the total taxable value of land and additions on the property. | Land | Improvement |
|---|---|---|---|---|
| 2025 | $5,563 | $376,200 | -- | $376,200 |
| 2024 | $5,114 | $387,900 | -- | $387,900 |
| 2023 | $5,114 | $351,300 | $0 | $351,300 |
| 2022 | $4,439 | $281,100 | $0 | $281,100 |
| 2021 | $4,150 | $255,000 | $0 | $255,000 |
| 2020 | $3,856 | $232,300 | $0 | $232,300 |
| 2019 | $4,039 | $241,200 | $0 | $241,200 |
| 2018 | $4,020 | $231,100 | $0 | $231,100 |
| 2017 | $3,976 | $222,800 | $0 | $222,800 |
| 2016 | $4,103 | $218,900 | $0 | $218,900 |
| 2015 | $4,157 | $228,600 | $0 | $228,600 |
| 2014 | $3,734 | $195,000 | $0 | $195,000 |
Source: Public Records
Map
Nearby Homes
- 900 Croton Rd Unit 102
- 928 Spring Park Loop
- 754 Centervale Dr
- 1120 Celebration Ave
- 815 Spring Park Loop
- 1565 Castile St
- 770 Siena Palm Dr Unit 201
- 770 Siena Palm Dr Unit 203
- 1013 Maiden Terrace
- 1007 Siena Park Blvd E
- 760 Siena Palm Dr Unit 204
- 760 Siena Palm Dr Unit 102
- 1587 Castile St
- 1418 Resolute St
- 1020 Siena Park Blvd W Unit 304
- 1031 Jeater Bend Dr
- 1001 Via Capri Ln Unit 201
- 1021 Siena Park Blvd E Unit 103
- 1021 Siena Park Blvd E Unit 301
- 1101 Banks Rose Ct
- 863 Spring Park Loop
- 863 Spring Park Loop Unit 201
- 863 Spring Park Loop Unit 102
- 863 Spring Park Loop Unit 101
- 869 Spring Park Loop
- 871 Spring Park Loop
- 873 Spring Park Loop
- 864 Spring Park Loop
- 862 Spring Park Loop
- 866 Spring Park Loop
- 860 Spring Park Loop
- 868 Spring Park Loop
- 870 Spring Park Loop Unit B
- 870 Spring Park Loop
- 875 Spring Park Loop
- 872 Spring Park Loop
- 900 Spring Park St Unit 7-101
- 900 Spring Park St Unit 304
- 900 Spring Park St Unit 304
- 900 Spring Park St Unit 303
Your Personal Tour Guide
Ask me questions while you tour the home.