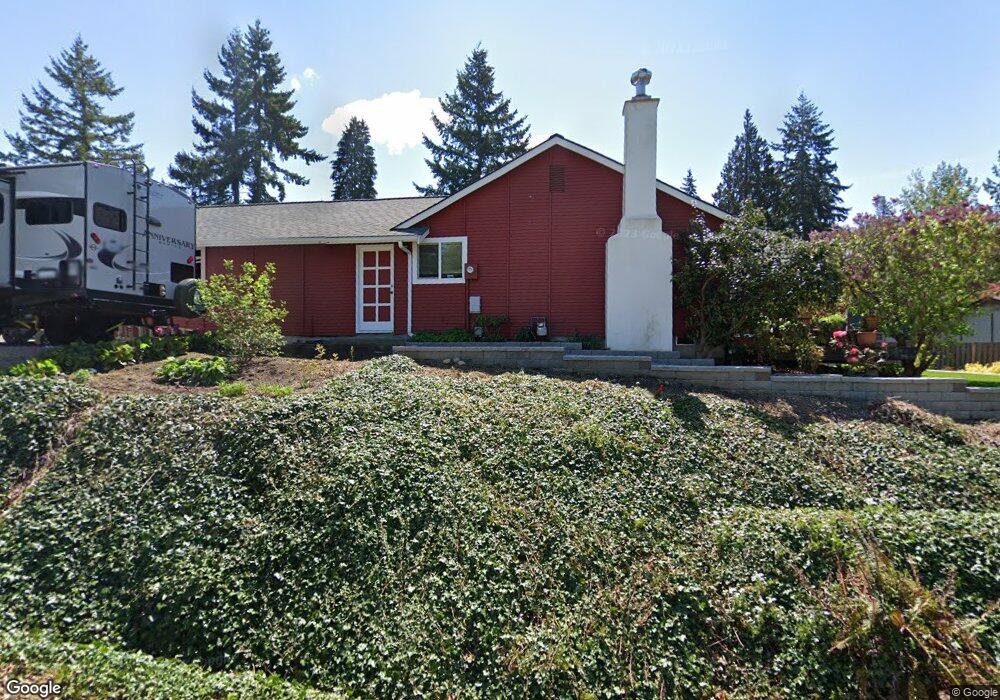
863 St Andrews Way Bellingham, WA 98229
Estimated Value: $690,000 - $789,000
3
Beds
2
Baths
1,927
Sq Ft
$378/Sq Ft
Est. Value
About This Home
This home is located at 863 St Andrews Way, Bellingham, WA 98229 and is currently estimated at $728,692, approximately $378 per square foot. 863 St Andrews Way is a home located in Whatcom County with nearby schools including Wade King Elementary School, Fairhaven Middle School, and Sehome High School.
Create a Home Valuation Report for This Property
The Home Valuation Report is an in-depth analysis detailing your home's value as well as a comparison with similar homes in the area
Home Values in the Area
Average Home Value in this Area
Tax History Compared to Growth
Tax History
| Year | Tax Paid | Tax Assessment Tax Assessment Total Assessment is a certain percentage of the fair market value that is determined by local assessors to be the total taxable value of land and additions on the property. | Land | Improvement |
|---|---|---|---|---|
| 2024 | $5,439 | $626,935 | $244,963 | $381,972 |
| 2023 | $5,439 | $649,349 | $253,721 | $395,628 |
| 2022 | $4,686 | $552,641 | $215,934 | $336,707 |
| 2021 | $4,175 | $445,690 | $174,145 | $271,545 |
| 2020 | $4,087 | $390,953 | $152,758 | $238,195 |
| 2019 | $3,359 | $371,099 | $145,000 | $226,099 |
| 2018 | $3,500 | $306,050 | $98,735 | $207,315 |
| 2017 | $3,091 | $271,663 | $87,640 | $184,023 |
| 2016 | $2,799 | $250,196 | $80,640 | $169,556 |
| 2015 | $2,748 | $237,315 | $76,440 | $160,875 |
| 2014 | -- | $226,008 | $72,800 | $153,208 |
| 2013 | -- | $214,672 | $70,000 | $144,672 |
Source: Public Records
Map
Nearby Homes
- 2496 Yew Street Rd
- 842 Woodbine Way
- 0 Princeton Ct
- 2284 Yew Street Rd Unit B6
- 2284 Yew Street Rd Unit D3
- 905 Queen St
- 0 Lopez St
- 143 S 44th St
- 1146 Whidbey St
- 1101 Whidbey St
- 115 43rd St
- 2501 Fireweed Ln
- 4224 Dumas Ave
- 1401 Edwards St
- 1125 Divine Ln
- 1110 Divine Ln
- 1211 Kenoyer Dr
- 4007 Adams Ave
- 1227 Puget St
- 0 US Highway 27 Hwy N Unit MFRP4936152
- 867 St Andrews Way
- 859 St Andrews Way
- 855 St Andrews Way
- 871 St Andrews Way
- 894 St Andrews Way
- 860 St Andrews Way
- 887 St Andrews Way
- 875 St Andrews Way
- 883 St Andrews Way
- 891 St Andrews Way
- 851 St Andrews Way
- 856 St Andrews Way
- 879 St Andrews Way
- 898 St Andrews Way
- 895 St Andrews Way
- 865 Woodbine Way
- 852 St Andrews Way
- 859 Woodbine Way
- 2497 Autumnwood Ct
- 847 St Andrews Way