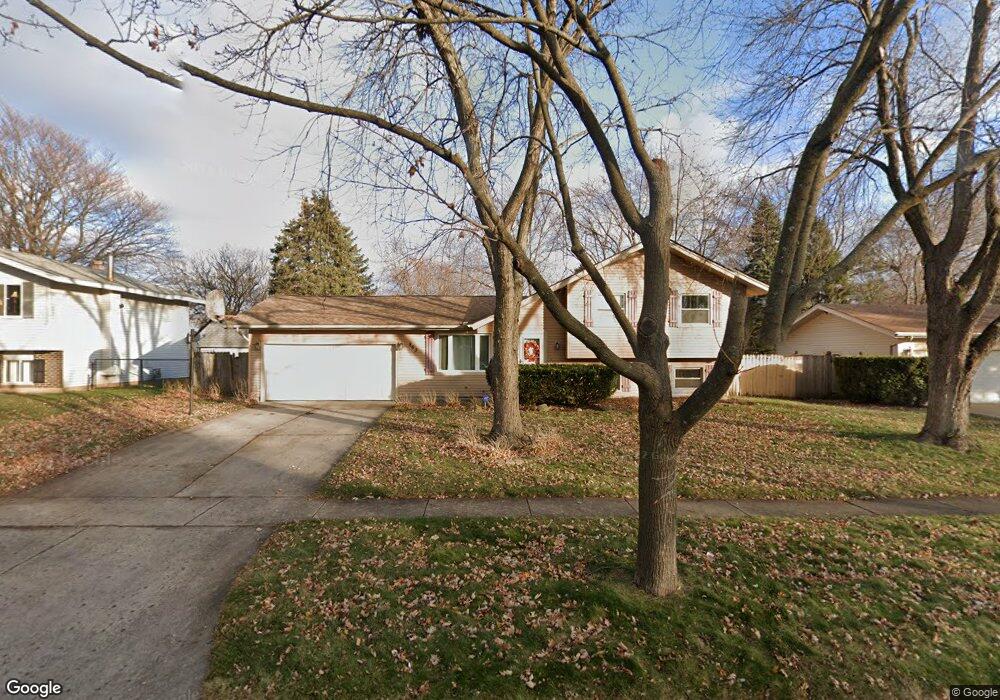
863 Teverton Ln Crystal Lake, IL 60014
Estimated Value: $306,000 - $348,000
3
Beds
2
Baths
1,026
Sq Ft
$320/Sq Ft
Est. Value
About This Home
This home is located at 863 Teverton Ln, Crystal Lake, IL 60014 and is currently estimated at $328,235, approximately $319 per square foot. 863 Teverton Ln is a home located in McHenry County with nearby schools including Canterbury Elementary School, Lundahl Middle School, and Crystal Lake South High School.
Ownership History
Date
Name
Owned For
Owner Type
Purchase Details
Closed on
Apr 5, 2010
Sold by
The Bank Of New York Mellon
Bought by
Conrad David A
Current Estimated Value
Home Financials for this Owner
Home Financials are based on the most recent Mortgage that was taken out on this home.
Original Mortgage
$112,500
Outstanding Balance
$75,114
Interest Rate
5.05%
Mortgage Type
New Conventional
Estimated Equity
$253,121
Purchase Details
Closed on
Jan 8, 2010
Sold by
Liveris Dean J
Bought by
The Bank Of New York Mellon and The Bank Of New York
Purchase Details
Closed on
Oct 10, 1997
Sold by
Tomaszewski Joseph A and Tomaszewski Jennifer L
Bought by
Liveris Dean J and Liveris Cheryl L
Home Financials for this Owner
Home Financials are based on the most recent Mortgage that was taken out on this home.
Original Mortgage
$126,000
Interest Rate
7.7%
Create a Home Valuation Report for This Property
The Home Valuation Report is an in-depth analysis detailing your home's value as well as a comparison with similar homes in the area
Home Values in the Area
Average Home Value in this Area
Purchase History
| Date | Buyer | Sale Price | Title Company |
|---|---|---|---|
| Conrad David A | $150,000 | Fatic | |
| The Bank Of New York Mellon | -- | None Available | |
| Liveris Dean J | $136,000 | Universal Title Services Inc |
Source: Public Records
Mortgage History
| Date | Status | Borrower | Loan Amount |
|---|---|---|---|
| Open | Conrad David A | $112,500 | |
| Previous Owner | Liveris Dean J | $126,000 |
Source: Public Records
Tax History Compared to Growth
Tax History
| Year | Tax Paid | Tax Assessment Tax Assessment Total Assessment is a certain percentage of the fair market value that is determined by local assessors to be the total taxable value of land and additions on the property. | Land | Improvement |
|---|---|---|---|---|
| 2024 | $8,094 | $95,612 | $18,337 | $77,275 |
| 2023 | $7,874 | $85,513 | $16,400 | $69,113 |
| 2022 | $6,644 | $70,142 | $23,594 | $46,548 |
| 2021 | $6,311 | $65,346 | $21,981 | $43,365 |
| 2020 | $6,167 | $63,033 | $21,203 | $41,830 |
| 2019 | $6,023 | $60,330 | $20,294 | $40,036 |
| 2018 | $5,986 | $58,774 | $17,031 | $41,743 |
| 2017 | $5,977 | $55,369 | $16,044 | $39,325 |
| 2016 | $5,856 | $51,931 | $15,048 | $36,883 |
| 2013 | -- | $47,349 | $14,038 | $33,311 |
Source: Public Records
Map
Nearby Homes
- 896 Canterbury Dr
- 901 Aberdeen Dr
- 860 Darlington Ln
- 584 Somerset Ln Unit 5
- 160 Surrey Ln
- Chelsea Plan at Waterside at Three Oaks
- Chatham Plan at Waterside at Three Oaks
- Amherst Plan at Waterside at Three Oaks
- 699 Darlington Ln
- 1013 Nottingham Ln
- 698 Sussex Ln
- 600 Sussex Ln
- 511 Coventry Ln Unit 2
- 511 Coventry Ln Unit 3
- 501 Coventry Ln Unit 18
- 407 Keith Ave
- 542 Silver Aspen Cir
- 518 Silver Aspen Cir
- 567 Cress Creek Ln
- 221 Uteg St Unit G
- 871 Teverton Ln
- 855 Teverton Ln
- 866 Canterbury Dr
- 876 Canterbury Dr
- 856 Canterbury Dr
- 877 Teverton Ln
- 66 Barrow Dr
- 856 Teverton Ln
- 852 Canterbury Dr
- 882 Canterbury Dr
- 839 Teverton Ln
- 885 Teverton Ln
- 67 Barrow Dr
- 72 Barrow Dr
- 846 Canterbury Dr
- 886 Canterbury Dr
- 69 Sherbon Ln
- 831 Teverton Ln
- 888 Teverton Ln
- 895 Teverton Ln