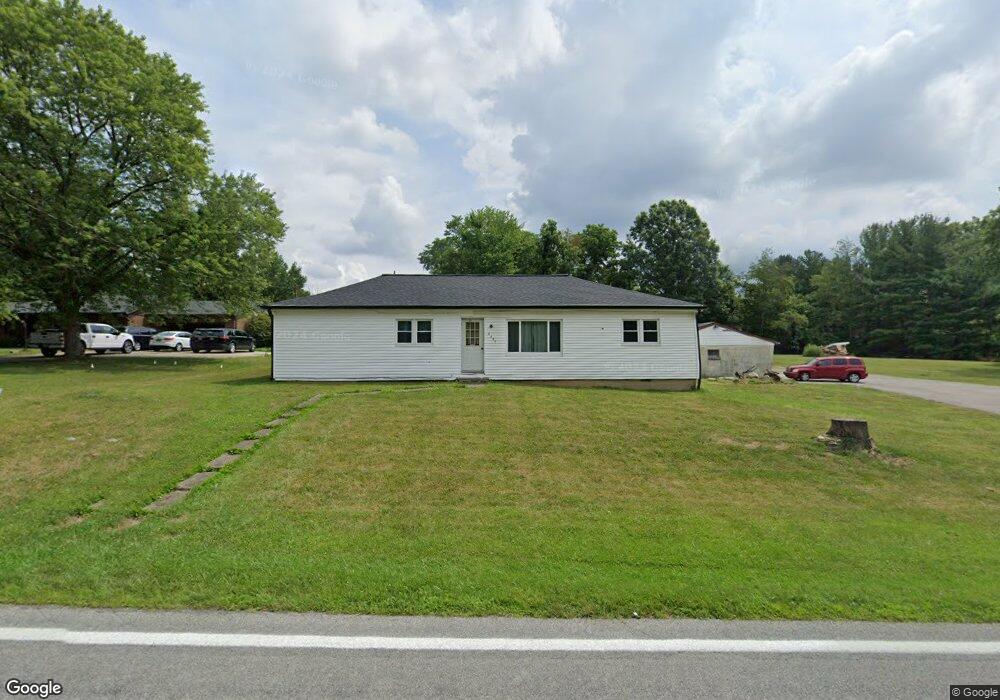
8630 S State Route 123 Blanchester, OH 45107
Estimated Value: $175,000 - $243,010
4
Beds
2
Baths
1,512
Sq Ft
$141/Sq Ft
Est. Value
About This Home
This home is located at 8630 S State Route 123, Blanchester, OH 45107 and is currently estimated at $213,253, approximately $141 per square foot. 8630 S State Route 123 is a home located in Warren County with nearby schools including Little Miami High School.
Ownership History
Date
Name
Owned For
Owner Type
Purchase Details
Closed on
Feb 22, 2011
Sold by
Coffey Leo and Coffey Deborah A
Bought by
Faulkner Jason A and Faulkner Tonya D
Current Estimated Value
Home Financials for this Owner
Home Financials are based on the most recent Mortgage that was taken out on this home.
Original Mortgage
$73,600
Outstanding Balance
$50,862
Interest Rate
4.99%
Mortgage Type
New Conventional
Estimated Equity
$162,391
Purchase Details
Closed on
Sep 23, 2009
Sold by
Wells Fargo Financial Ohio 1 Inc
Bought by
Coffey Leo and Coffey Deborah A
Purchase Details
Closed on
Sep 9, 2009
Sold by
Grossnickle Barry L
Bought by
Wells Fargo Financial Ohio 1 Inc
Purchase Details
Closed on
Dec 13, 2001
Sold by
Est Betty Grossnickle
Bought by
Grossnickle Barry L
Home Financials for this Owner
Home Financials are based on the most recent Mortgage that was taken out on this home.
Original Mortgage
$101,974
Interest Rate
6.6%
Mortgage Type
VA
Create a Home Valuation Report for This Property
The Home Valuation Report is an in-depth analysis detailing your home's value as well as a comparison with similar homes in the area
Home Values in the Area
Average Home Value in this Area
Purchase History
| Date | Buyer | Sale Price | Title Company |
|---|---|---|---|
| Faulkner Jason A | -- | Overbrook Title Services Inc | |
| Coffey Leo | $42,566 | Rels Title | |
| Wells Fargo Financial Ohio 1 Inc | $66,667 | None Available | |
| Grossnickle Barry L | $99,975 | -- |
Source: Public Records
Mortgage History
| Date | Status | Borrower | Loan Amount |
|---|---|---|---|
| Open | Faulkner Jason A | $73,600 | |
| Previous Owner | Grossnickle Barry L | $101,974 |
Source: Public Records
Tax History Compared to Growth
Tax History
| Year | Tax Paid | Tax Assessment Tax Assessment Total Assessment is a certain percentage of the fair market value that is determined by local assessors to be the total taxable value of land and additions on the property. | Land | Improvement |
|---|---|---|---|---|
| 2024 | $2,645 | $65,080 | $23,010 | $42,070 |
| 2023 | $2,252 | $50,106 | $12,733 | $37,373 |
| 2022 | $2,224 | $50,106 | $12,733 | $37,373 |
| 2021 | $2,108 | $50,106 | $12,733 | $37,373 |
| 2020 | $2,004 | $40,737 | $10,353 | $30,384 |
| 2019 | $2,076 | $40,737 | $10,353 | $30,384 |
| 2018 | $2,113 | $40,737 | $10,353 | $30,384 |
| 2017 | $1,903 | $36,558 | $9,520 | $27,038 |
| 2016 | $1,945 | $36,558 | $9,520 | $27,038 |
| 2015 | $1,948 | $36,558 | $9,520 | $27,038 |
| 2014 | $2,044 | $34,270 | $9,000 | $25,270 |
| 2013 | $2,008 | $40,240 | $10,350 | $29,890 |
Source: Public Records
Map
Nearby Homes
- 753 W Main St
- 305 W Main St
- 8347 McCulley Ln
- 502 Railroad St
- 416 N Broadway St
- 301 W Main St
- 213 N Broadway St
- ac Collins-Riley Rd
- 507 Bourbon St
- 217 Pansy Pike
- 9 Pansy Pike
- 12 Pansy Pike
- 10 Pansy Pike
- 11 Pansy Pike
- 124 Bourbon St
- 477 N Columbus St
- 8338 Gustin Rider Rd
- 0 Whitacre Rd Unit 1852936
- 304 Cherry St
- 107 Central Ave
- 8618 S State Route 123
- 8627 S State Route 123
- 8667 S State Route 123
- 8672 S State Route 123
- 8536 S State Route 123
- 8735 S State Route 123
- 8536 St Rt 123
- 8536 Ohio 123
- 8480 S State Route 123
- 8480 S St Rt 123
- 8776 Ohio 123
- 8776 S State Route 123
- 8776 St Rt 123
- 8797 S State Route 123
- 8479 S St Rt 123
- 8479 S State Route 123
- 10780 Watkins Bowman Rd
- 8477 S St Rt 123
- 8400 S State Route 123
- 8832 St Rt 123