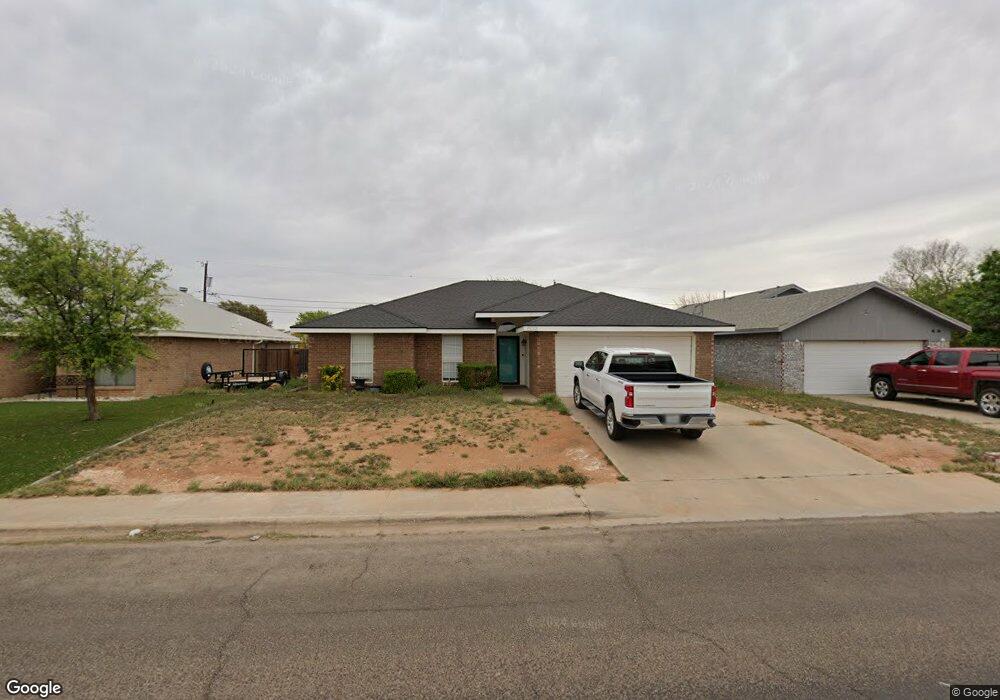
8632 Duke Ave Odessa, TX 79765
East Park NeighborhoodEstimated Value: $222,967 - $265,000
3
Beds
2
Baths
1,622
Sq Ft
$154/Sq Ft
Est. Value
About This Home
This home is located at 8632 Duke Ave, Odessa, TX 79765 and is currently estimated at $249,742, approximately $153 per square foot. 8632 Duke Ave is a home located in Ector County with nearby schools including Lee Buice Elementary School, Wilson & Young Medal of Honor Middle School, and Permian High School.
Ownership History
Date
Name
Owned For
Owner Type
Purchase Details
Closed on
Feb 27, 2009
Sold by
Levario Jeremiah J and Martinez Danielle D
Bought by
Blake Brandon and Blake Rebecca
Current Estimated Value
Home Financials for this Owner
Home Financials are based on the most recent Mortgage that was taken out on this home.
Original Mortgage
$152,167
Outstanding Balance
$95,675
Interest Rate
4.92%
Mortgage Type
FHA
Estimated Equity
$154,067
Purchase Details
Closed on
Jan 4, 2006
Sold by
Neves James Micah and Neves Farrah
Bought by
Levario Jeremiah J
Home Financials for this Owner
Home Financials are based on the most recent Mortgage that was taken out on this home.
Original Mortgage
$122,000
Interest Rate
6.2%
Mortgage Type
New Conventional
Create a Home Valuation Report for This Property
The Home Valuation Report is an in-depth analysis detailing your home's value as well as a comparison with similar homes in the area
Home Values in the Area
Average Home Value in this Area
Purchase History
| Date | Buyer | Sale Price | Title Company |
|---|---|---|---|
| Blake Brandon | -- | Basin Abstract & Title | |
| Levario Jeremiah J | -- | Basin Abstract & Title |
Source: Public Records
Mortgage History
| Date | Status | Borrower | Loan Amount |
|---|---|---|---|
| Open | Blake Brandon | $152,167 | |
| Previous Owner | Levario Jeremiah J | $122,000 |
Source: Public Records
Tax History Compared to Growth
Tax History
| Year | Tax Paid | Tax Assessment Tax Assessment Total Assessment is a certain percentage of the fair market value that is determined by local assessors to be the total taxable value of land and additions on the property. | Land | Improvement |
|---|---|---|---|---|
| 2024 | $2,217 | $190,520 | $18,169 | $172,351 |
| 2023 | $2,104 | $183,917 | $18,169 | $165,748 |
| 2022 | $4,683 | $202,697 | $20,734 | $181,963 |
| 2021 | $4,495 | $190,528 | $20,734 | $169,794 |
| 2020 | $4,130 | $178,073 | $13,181 | $164,892 |
| 2019 | $4,263 | $173,366 | $13,181 | $160,185 |
| 2018 | $3,700 | $157,170 | $13,181 | $143,989 |
| 2017 | $3,435 | $150,825 | $13,181 | $137,644 |
| 2016 | $3,349 | $150,825 | $13,181 | $137,644 |
| 2015 | $2,863 | $150,825 | $13,181 | $137,644 |
| 2014 | $2,863 | $144,298 | $13,181 | $131,117 |
Source: Public Records
Map
Nearby Homes