Estimated Value: $489,000 - $516,000
4
Beds
2
Baths
2,160
Sq Ft
$233/Sq Ft
Est. Value
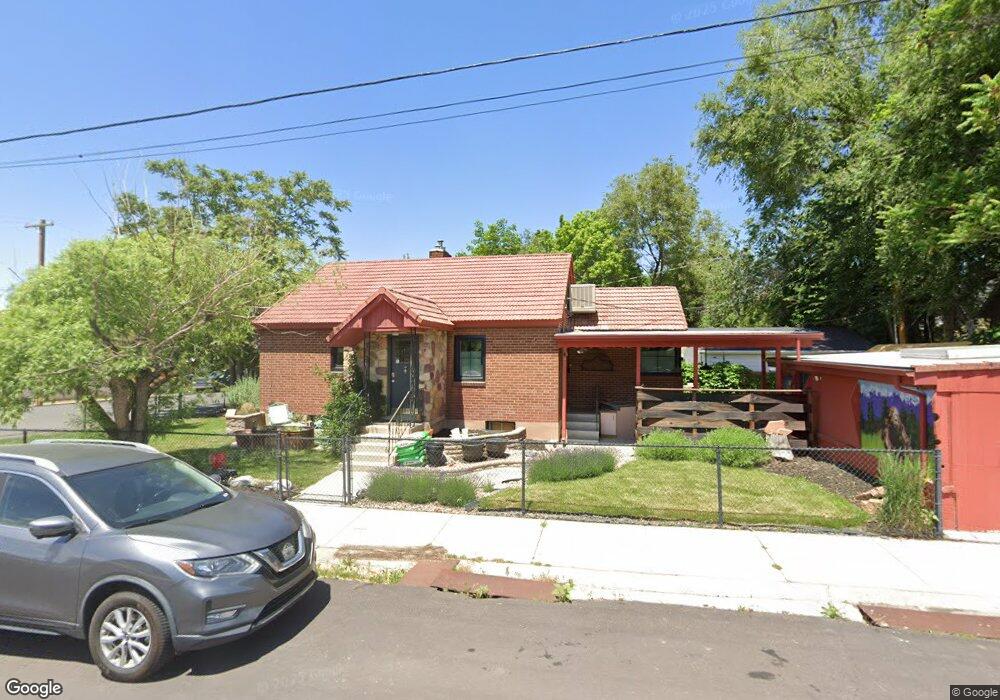
About This Home
This home is located at 8633 S 90 E, Sandy, UT 84070 and is currently estimated at $503,745, approximately $233 per square foot. 8633 S 90 E is a home located in Salt Lake County with nearby schools including Sandy Elementary School, Mount Jordan Middle School, and Jordan High.
Ownership History
Date
Name
Owned For
Owner Type
Purchase Details
Closed on
May 31, 2017
Sold by
Sengpraseut Douangprasit A and Sengpraseut Tina
Bought by
Miner Phillip W
Current Estimated Value
Home Financials for this Owner
Home Financials are based on the most recent Mortgage that was taken out on this home.
Original Mortgage
$226,800
Outstanding Balance
$188,391
Interest Rate
3.97%
Mortgage Type
New Conventional
Estimated Equity
$315,354
Purchase Details
Closed on
Sep 17, 1997
Sold by
Swapp Gloria J and Larson Russell D
Bought by
Sengpraseut Douangprasit A and Sengpraseut Tina
Home Financials for this Owner
Home Financials are based on the most recent Mortgage that was taken out on this home.
Original Mortgage
$120,041
Interest Rate
7.45%
Mortgage Type
FHA
Purchase Details
Closed on
Aug 16, 1996
Sold by
Swapp Gloria Jean and Larson Russell Delmas
Bought by
Swapp Gloria J and Larson Russell D
Create a Home Valuation Report for This Property
The Home Valuation Report is an in-depth analysis detailing your home's value as well as a comparison with similar homes in the area
Home Values in the Area
Average Home Value in this Area
Purchase History
| Date | Buyer | Sale Price | Title Company |
|---|---|---|---|
| Miner Phillip W | -- | Inwest Title Srvs Slc | |
| Sengpraseut Douangprasit A | -- | First American Title | |
| Swapp Gloria J | -- | -- |
Source: Public Records
Mortgage History
| Date | Status | Borrower | Loan Amount |
|---|---|---|---|
| Open | Miner Phillip W | $226,800 | |
| Previous Owner | Sengpraseut Douangprasit A | $120,041 |
Source: Public Records
Tax History
| Year | Tax Paid | Tax Assessment Tax Assessment Total Assessment is a certain percentage of the fair market value that is determined by local assessors to be the total taxable value of land and additions on the property. | Land | Improvement |
|---|---|---|---|---|
| 2025 | $2,308 | $483,700 | $101,400 | $382,300 |
| 2024 | $2,308 | $426,800 | $93,000 | $333,800 |
| 2023 | $2,089 | $385,200 | $88,400 | $296,800 |
| 2022 | $2,235 | $402,700 | $86,700 | $316,000 |
| 2021 | $2,137 | $327,700 | $67,900 | $259,800 |
| 2020 | $1,988 | $287,500 | $67,900 | $219,600 |
| 2019 | $1,904 | $268,300 | $67,900 | $200,400 |
| 2016 | $1,360 | $184,300 | $48,900 | $135,400 |
Source: Public Records
Map
Nearby Homes
- 112 E 8680 S
- 8558 S Center St
- 149 E Pioneer Ave
- 87 Pioneer Ave
- 194 Pioneer Ave
- 220 E Pioneer Ave
- 8470 Solar Way
- 270 E 8680 S
- 227 E St Germain Way
- 8459 S 300 E
- 87 W 8710 S
- 132 E Chambord Ct
- 36 E Opequon Rd
- 136 E Chambord Ct
- 138 E Chambord Ct
- 140 E Chambord Ct
- 144 E Chambord Ct
- 8278 S Resaca Dr Unit L1
- 412 E 8760 S
- 117 E Calbourne Ln Unit I4
Your Personal Tour Guide
Ask me questions while you tour the home.