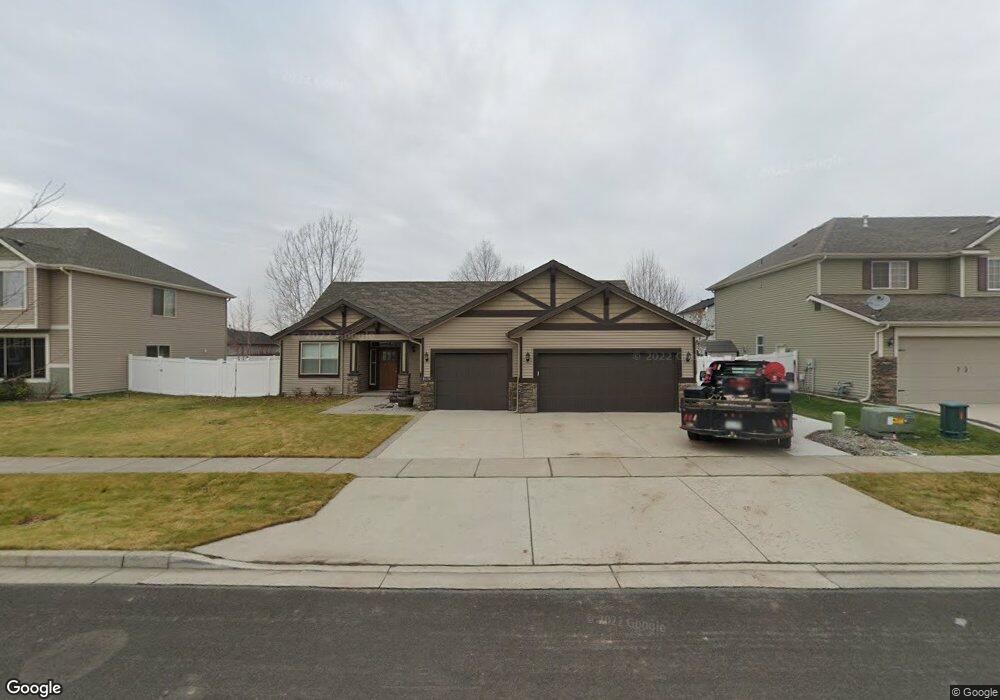
8634 N Salmonberry Loop Hayden, ID 83835
Estimated Value: $590,579 - $610,000
3
Beds
2
Baths
2,123
Sq Ft
$283/Sq Ft
Est. Value
About This Home
This home is located at 8634 N Salmonberry Loop, Hayden, ID 83835 and is currently estimated at $600,895, approximately $283 per square foot. 8634 N Salmonberry Loop is a home with nearby schools including Atlas Elementary School, Woodland Middle School, and Lake City High School.
Ownership History
Date
Name
Owned For
Owner Type
Purchase Details
Closed on
May 22, 2020
Sold by
Brown Micliele L
Bought by
Brown Michele L and Brown Toby N
Current Estimated Value
Home Financials for this Owner
Home Financials are based on the most recent Mortgage that was taken out on this home.
Original Mortgage
$275,000
Outstanding Balance
$188,114
Interest Rate
3.3%
Mortgage Type
New Conventional
Estimated Equity
$412,781
Purchase Details
Closed on
Sep 11, 2012
Sold by
Brown Toby N
Bought by
Brown Mitchele L
Home Financials for this Owner
Home Financials are based on the most recent Mortgage that was taken out on this home.
Original Mortgage
$204,772
Interest Rate
3.5%
Mortgage Type
New Conventional
Purchase Details
Closed on
Feb 24, 2009
Sold by
Grilli William and Grilli Deborah
Bought by
Grilli William R and Grilli Deborah M
Purchase Details
Closed on
Feb 2, 2006
Sold by
Grilli Deborah
Bought by
Grilli William
Create a Home Valuation Report for This Property
The Home Valuation Report is an in-depth analysis detailing your home's value as well as a comparison with similar homes in the area
Purchase History
| Date | Buyer | Sale Price | Title Company |
|---|---|---|---|
| Brown Michele L | -- | Alliance Ttl Coeur D Alene O | |
| Brown Mitchele L | -- | None Available | |
| Brown Michele L | -- | First American Title Kootena | |
| Grilli William R | -- | -- | |
| Grilli William | -- | -- |
Source: Public Records
Mortgage History
| Date | Status | Borrower | Loan Amount |
|---|---|---|---|
| Open | Brown Michele L | $275,000 | |
| Closed | Brown Michele L | $204,772 |
Source: Public Records
Tax History
| Year | Tax Paid | Tax Assessment Tax Assessment Total Assessment is a certain percentage of the fair market value that is determined by local assessors to be the total taxable value of land and additions on the property. | Land | Improvement |
|---|---|---|---|---|
| 2025 | $1,864 | $565,840 | $190,000 | $375,840 |
| 2024 | $1,768 | $550,410 | $175,000 | $375,410 |
| 2023 | $1,768 | $574,181 | $180,000 | $394,181 |
| 2022 | $2,195 | $635,476 | $200,000 | $435,476 |
| 2021 | $2,121 | $426,537 | $125,000 | $301,537 |
| 2020 | $2,158 | $370,592 | $100,000 | $270,592 |
| 2019 | $2,098 | $341,283 | $96,800 | $244,483 |
| 2018 | $1,951 | $299,700 | $88,000 | $211,700 |
| 2017 | $1,778 | $268,990 | $65,000 | $203,990 |
| 2016 | $1,699 | $249,430 | $57,500 | $191,930 |
| 2015 | $1,561 | $227,510 | $46,000 | $181,510 |
| 2013 | $1,421 | $197,550 | $36,800 | $160,750 |
Source: Public Records
Map
Nearby Homes
- 2547 W Blackberry Loop
- 2715 W Broadmoore Dr
- 7948 N Darlena Loop
- 7970 N Darlena Loop
- 8188 N Ainsworth Dr
- 1810 W Honeysuckle Ave
- 7996 N Hibiscus Ln
- 3294 W Giovanni Ln
- 9481 N Chateaux Dr
- 3260 W Magistrate Loop
- 3520 W Cranston Ave
- 7767 N Coneflower St
- 7863 N Mocha Loop
- 7857 N Mocha Loop
- 7853 N Mocha Loop
- 7847 N Mocha Loop
- 7833 N Mocha Loop
- 1563 W Woodlawn Dr
- 1627 W Cardinal Ave
- 7827 N Mocha Loop
- 8616 Salmonberry
- 8652 Salmonberry
- 8464 N Boysenberry Loop
- 8482 N Boysenberry Loop
- 8598 Salmonberry
- 8670 Salmonberry
- 8446 Boysenberry Loop
- 8500 N Boysenberry Loop
- 8629 N Salmonberry Loop
- 8647 Salmonberry
- 8611 Salmonberry
- 8665 Salmonberry
- 8428 N Boysenberry Loop
- 8508 N Boysenberry Loop
- 8688 Salmonberry
- 8590 Salmonberry
- 8428 Boysenberry Loop
- 8593 Salmonberry
- 8683 Salmonberry
- 8463 N Boysenberry Loop
Your Personal Tour Guide
Ask me questions while you tour the home.