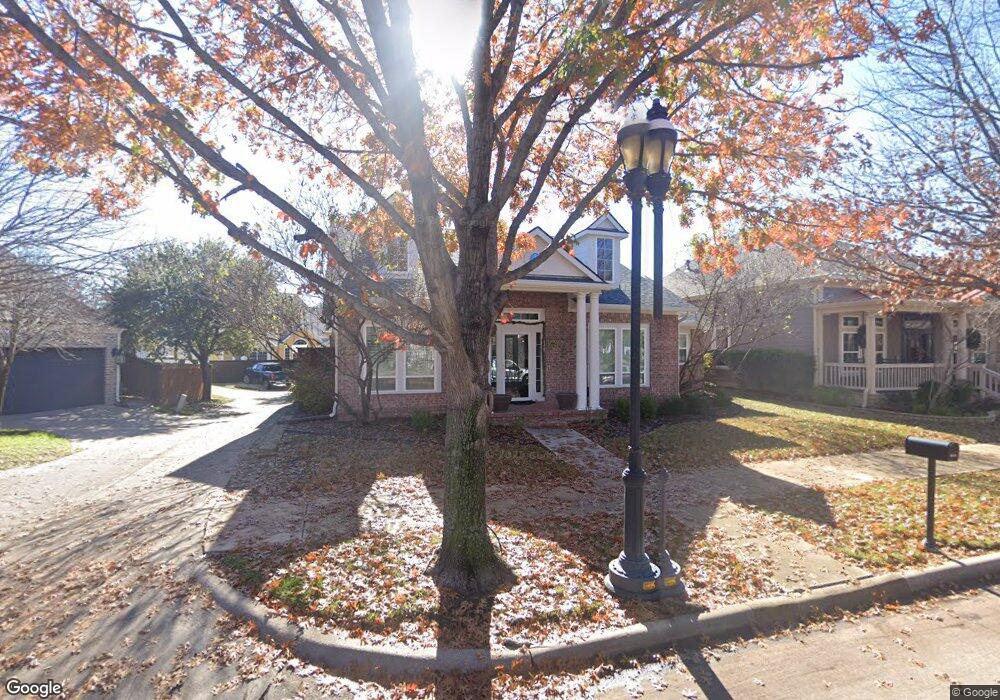
8636 Bridge St North Richland Hills, TX 76180
Estimated Value: $484,524 - $519,000
3
Beds
2
Baths
1,931
Sq Ft
$257/Sq Ft
Est. Value
About This Home
This home is located at 8636 Bridge St, North Richland Hills, TX 76180 and is currently estimated at $496,381, approximately $257 per square foot. 8636 Bridge St is a home located in Tarrant County with nearby schools including Walker Creek Elementary School, Smithfield Middle School, and Birdville High School.
Ownership History
Date
Name
Owned For
Owner Type
Purchase Details
Closed on
Jan 14, 2016
Sold by
Banko Denise G and Antley James D
Bought by
Allen Gregory S
Current Estimated Value
Home Financials for this Owner
Home Financials are based on the most recent Mortgage that was taken out on this home.
Original Mortgage
$218,400
Outstanding Balance
$173,584
Interest Rate
3.94%
Mortgage Type
New Conventional
Estimated Equity
$322,797
Purchase Details
Closed on
Mar 2, 2006
Sold by
Turturro Chris and Turturro Anne
Bought by
Banko Denise G
Home Financials for this Owner
Home Financials are based on the most recent Mortgage that was taken out on this home.
Original Mortgage
$141,592
Interest Rate
6.09%
Mortgage Type
FHA
Purchase Details
Closed on
Jul 14, 2003
Sold by
Weekley Homes Lp
Bought by
Turturro Chris and Turturro Anne
Home Financials for this Owner
Home Financials are based on the most recent Mortgage that was taken out on this home.
Original Mortgage
$152,833
Interest Rate
5.19%
Mortgage Type
Purchase Money Mortgage
Create a Home Valuation Report for This Property
The Home Valuation Report is an in-depth analysis detailing your home's value as well as a comparison with similar homes in the area
Home Values in the Area
Average Home Value in this Area
Purchase History
| Date | Buyer | Sale Price | Title Company |
|---|---|---|---|
| Allen Gregory S | -- | Capital Title | |
| Banko Denise G | -- | Commonwealth Land | |
| Turturro Chris | -- | Priority Title Company |
Source: Public Records
Mortgage History
| Date | Status | Borrower | Loan Amount |
|---|---|---|---|
| Open | Allen Gregory S | $218,400 | |
| Previous Owner | Banko Denise G | $141,592 | |
| Previous Owner | Turturro Chris | $152,833 | |
| Closed | Turturro Chris | $36,509 |
Source: Public Records
Tax History Compared to Growth
Tax History
| Year | Tax Paid | Tax Assessment Tax Assessment Total Assessment is a certain percentage of the fair market value that is determined by local assessors to be the total taxable value of land and additions on the property. | Land | Improvement |
|---|---|---|---|---|
| 2025 | $7,297 | $417,000 | $56,440 | $360,560 |
| 2024 | $7,297 | $444,496 | $56,440 | $388,056 |
| 2023 | $8,484 | $483,327 | $56,440 | $426,887 |
| 2022 | $8,461 | $412,433 | $56,440 | $355,993 |
| 2021 | $8,133 | $319,630 | $75,000 | $244,630 |
| 2020 | $8,133 | $319,630 | $75,000 | $244,630 |
| 2019 | $7,981 | $319,631 | $75,000 | $244,631 |
| 2018 | $6,650 | $275,500 | $70,000 | $205,500 |
| 2017 | $7,412 | $275,500 | $70,000 | $205,500 |
| 2016 | $7,056 | $278,566 | $40,000 | $238,566 |
| 2015 | $5,971 | $238,400 | $40,000 | $198,400 |
| 2014 | $5,971 | $238,400 | $40,000 | $198,400 |
Source: Public Records
Map
Nearby Homes
- 6008 Monterey Mews
- 8908 Redding St
- 6025 Kessler Dr
- 8765 Bridge St
- 6116 Morningside Dr
- 8321 Bridge St
- 6001 Kessler Dr
- 6008 Kessler Dr
- 8748 Morris Mews
- 6105 Parker Blvd
- 6137 Marquita Mews
- 6124 Mayfair Mews
- 8740 Ice House Dr
- 8858 Mandalay St
- 6113 Cliffbrook Dr
- 8240 Bridge St
- 8886 Ice House Dr
- 7800 Mockingbird Ln Unit 29
- 7800 Mockingbird Ln Unit 81
- 7800 Mockingbird Ln Unit 73
- 8632 Bridge St
- 5967 Lake Way
- 5973 Lake Way
- 8628 Bridge St
- 5963 Lake Way
- 8629 Olmstead Terrace
- 8625 Olmstead Terrace
- 8624 Bridge St
- 8637 Bridge St
- 8633 Bridge St
- 6001 Lake Way
- 8621 Olmstead Terrace
- 8629 Bridge St
- 6005 Lake Way
- 8620 Bridge St
- 8625 Bridge St
- 8617 Olmstead Terrace
- 8621 Bridge St
- 8613 Olmstead Terrace
- 5958 Lake Way Mews