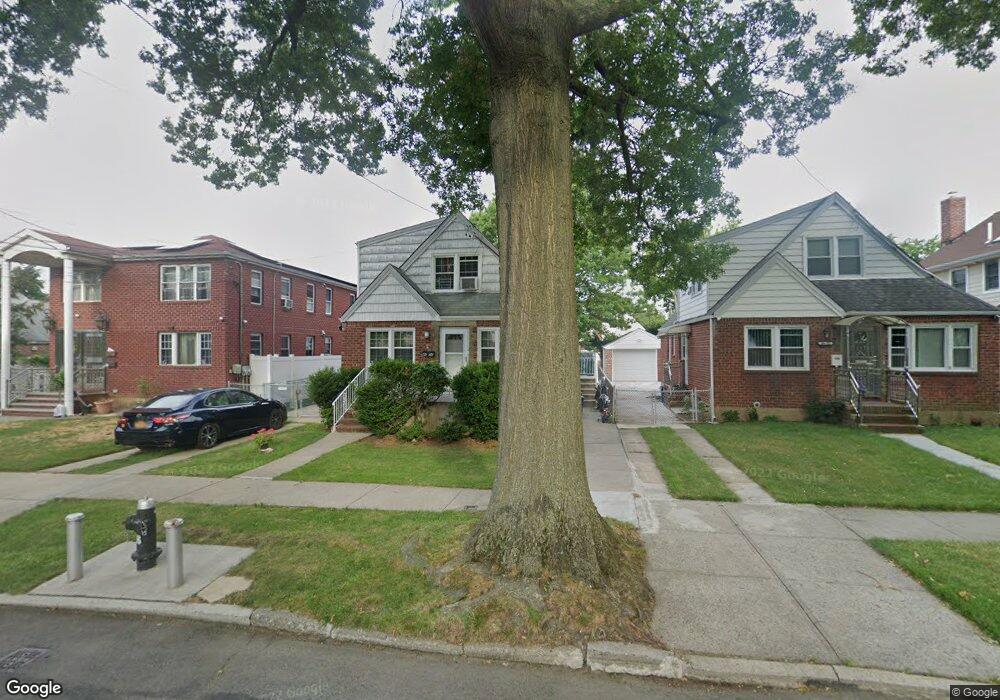
8636 Range St Queens Village, NY 11427
Bellerose NeighborhoodEstimated Value: $882,887 - $1,077,000
--
Bed
--
Bath
1,704
Sq Ft
$583/Sq Ft
Est. Value
About This Home
This home is located at 8636 Range St, Queens Village, NY 11427 and is currently estimated at $993,972, approximately $583 per square foot. 8636 Range St is a home located in Queens County with nearby schools including P.S. 18 Q The Winchester School, Irwin Altman Middle School 172, and Martin Van Buren High School.
Ownership History
Date
Name
Owned For
Owner Type
Purchase Details
Closed on
Jul 1, 2003
Sold by
Sharif Anis
Bought by
Kaur Charanjit and Singh Bhupinder
Current Estimated Value
Purchase Details
Closed on
Oct 28, 2002
Sold by
Cendant Mobility Financial Corporation
Bought by
Sharif Anis
Home Financials for this Owner
Home Financials are based on the most recent Mortgage that was taken out on this home.
Original Mortgage
$321,200
Interest Rate
6.25%
Mortgage Type
Purchase Money Mortgage
Purchase Details
Closed on
Aug 14, 2002
Sold by
Canlas Jeremias D
Bought by
Cendant Mobility Financial Corporation
Purchase Details
Closed on
May 1, 2000
Sold by
Canlas Jeremias V and Canlas Erlinda D
Bought by
Canlas Jeremias D
Home Financials for this Owner
Home Financials are based on the most recent Mortgage that was taken out on this home.
Original Mortgage
$155,000
Interest Rate
7.87%
Mortgage Type
Purchase Money Mortgage
Create a Home Valuation Report for This Property
The Home Valuation Report is an in-depth analysis detailing your home's value as well as a comparison with similar homes in the area
Home Values in the Area
Average Home Value in this Area
Purchase History
| Date | Buyer | Sale Price | Title Company |
|---|---|---|---|
| Kaur Charanjit | $440,000 | -- | |
| Kaur Charanjit | $440,000 | -- | |
| Sharif Anis | $401,500 | -- | |
| Sharif Anis | $401,500 | -- | |
| Cendant Mobility Financial Corporation | $401,500 | -- | |
| Cendant Mobility Financial Corporation | $401,500 | -- | |
| Canlas Jeremias D | $235,000 | Fidelity National Title Ins | |
| Canlas Jeremias D | -- | Fidelity National Title Ins |
Source: Public Records
Mortgage History
| Date | Status | Borrower | Loan Amount |
|---|---|---|---|
| Previous Owner | Sharif Anis | $321,200 | |
| Previous Owner | Canlas Jeremias D | $155,000 | |
| Closed | Kaur Charanjit | $0 |
Source: Public Records
Tax History Compared to Growth
Tax History
| Year | Tax Paid | Tax Assessment Tax Assessment Total Assessment is a certain percentage of the fair market value that is determined by local assessors to be the total taxable value of land and additions on the property. | Land | Improvement |
|---|---|---|---|---|
| 2025 | $8,818 | $44,237 | $12,541 | $31,696 |
| 2024 | $8,818 | $43,903 | $12,629 | $31,274 |
| 2023 | $8,319 | $41,419 | $11,482 | $29,937 |
| 2022 | $7,801 | $55,140 | $16,500 | $38,640 |
| 2021 | $7,758 | $54,240 | $16,500 | $37,740 |
| 2020 | $7,803 | $49,020 | $16,500 | $32,520 |
| 2019 | $7,653 | $51,120 | $16,500 | $34,620 |
| 2018 | $7,036 | $34,516 | $11,970 | $22,546 |
| 2017 | $6,638 | $32,563 | $14,169 | $18,394 |
| 2016 | $6,141 | $32,563 | $14,169 | $18,394 |
| 2015 | $3,903 | $32,436 | $17,505 | $14,931 |
| 2014 | $3,903 | $30,711 | $16,603 | $14,108 |
Source: Public Records
Map
Nearby Homes
- 233-16 87th Ave
- 82-159 Country Pointe Cir
- 86-21 233rd St
- 231-22 87th Ave
- 88-29 Winchester Blvd
- 8922 Moline St
- 23026 87th Ave
- 222-89 Braddock Ave Unit 4B
- 222-89 Braddock Ave Unit 2-E
- 222-89 Braddock Ave Unit 5A
- 222-89 Braddock Ave Unit 6-D
- 23009 87th Ave
- 22289 Braddock Ave Unit 1G
- 8948 Pontiac St
- 82-39 232nd St
- 86-06 231st St
- 86-06 231st St Unit Upper
- 229-15 87th Ave Unit 454
- 229-17 87th Ave Unit LOWER
- 229-17 87th Ave
- 8632 Range St
- 8640 Range St
- 8628 Range St
- 86-46 Range St
- 8639 Musket St
- 8635 Musket St
- 8648 Range St
- 8643 Musket St
- 8631 Musket St
- 8624 Range St
- 86-31 Musket St
- 8647 Musket St
- 8627 Musket St
- 86-32 Range St
- 8620 Range St
- 8651 Musket St
- 8623 Musket St
- 8656 Range St
- 86-59 Musket St
- 8656 Range St Unit 2nd Fl