Estimated Value: $559,000 - $625,000
5
Beds
3
Baths
2,654
Sq Ft
$219/Sq Ft
Est. Value
About This Home
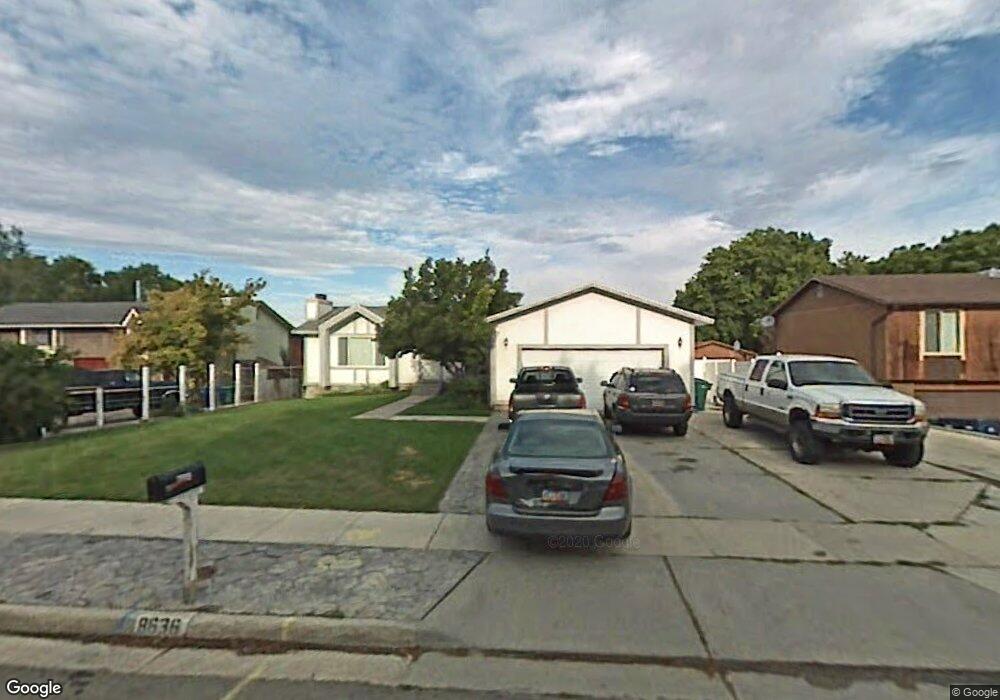
This home is located at 8636 S 550 E, Sandy, UT 84070 and is currently estimated at $580,348, approximately $218 per square foot. 8636 S 550 E is a home located in Salt Lake County with nearby schools including Sandy Elementary School, Mount Jordan Middle School, and Jordan High.
Ownership History
Date
Name
Owned For
Owner Type
Purchase Details
Closed on
Sep 8, 2017
Sold by
Watanabe Kenneth M and Watanabe Christine A
Bought by
Watanabe Kenneth M and Watanabe Christine A
Current Estimated Value
Purchase Details
Closed on
Dec 23, 2013
Sold by
Pulliam John Paul
Bought by
Pulliam John Paul and Pulliam Pamela
Home Financials for this Owner
Home Financials are based on the most recent Mortgage that was taken out on this home.
Original Mortgage
$208,000
Interest Rate
4.32%
Mortgage Type
New Conventional
Purchase Details
Closed on
Nov 23, 2011
Sold by
Pulliam Jp
Bought by
Pulliam John Paul
Home Financials for this Owner
Home Financials are based on the most recent Mortgage that was taken out on this home.
Original Mortgage
$175,437
Interest Rate
3.87%
Mortgage Type
FHA
Purchase Details
Closed on
Nov 22, 2011
Sold by
Fannie Mae
Bought by
Pulliam Jp
Home Financials for this Owner
Home Financials are based on the most recent Mortgage that was taken out on this home.
Original Mortgage
$175,437
Interest Rate
3.87%
Mortgage Type
FHA
Purchase Details
Closed on
Apr 20, 2011
Sold by
North Gary L
Bought by
Federal National Mortgage Association
Purchase Details
Closed on
Feb 12, 2007
Sold by
North Gary L
Bought by
North Gary L and North Jami G
Home Financials for this Owner
Home Financials are based on the most recent Mortgage that was taken out on this home.
Original Mortgage
$200,000
Interest Rate
6.19%
Mortgage Type
New Conventional
Purchase Details
Closed on
Jan 29, 2007
Sold by
Graham Vern E
Bought by
North Gary L
Home Financials for this Owner
Home Financials are based on the most recent Mortgage that was taken out on this home.
Original Mortgage
$200,000
Interest Rate
6.19%
Mortgage Type
New Conventional
Purchase Details
Closed on
Oct 19, 1999
Sold by
Wilson Steven D and Wilson Lisa Ann
Bought by
Graham Vern E
Home Financials for this Owner
Home Financials are based on the most recent Mortgage that was taken out on this home.
Original Mortgage
$163,667
Interest Rate
7.75%
Mortgage Type
VA
Purchase Details
Closed on
Jul 14, 1995
Sold by
Harris Stanley D and Stanley Della
Bought by
Wilson Steven D and Wilson Lisa Ann
Home Financials for this Owner
Home Financials are based on the most recent Mortgage that was taken out on this home.
Original Mortgage
$121,000
Interest Rate
7.74%
Create a Home Valuation Report for This Property
The Home Valuation Report is an in-depth analysis detailing your home's value as well as a comparison with similar homes in the area
Home Values in the Area
Average Home Value in this Area
Purchase History
| Date | Buyer | Sale Price | Title Company |
|---|---|---|---|
| Watanabe Kenneth M | -- | None Available | |
| Pulliam John Paul | -- | Metro National Title | |
| Pulliam John Paul | -- | United Title Services | |
| Pulliam Jp | $180,000 | United Title Services | |
| Federal National Mortgage Association | $204,197 | Accommodation | |
| North Gary L | -- | Integrated Title Ins Svcs | |
| North Gary L | -- | Accommodation | |
| Graham Vern E | -- | Equity Title | |
| Wilson Steven D | -- | -- |
Source: Public Records
Mortgage History
| Date | Status | Borrower | Loan Amount |
|---|---|---|---|
| Previous Owner | Pulliam John Paul | $208,000 | |
| Previous Owner | Pulliam Jp | $175,437 | |
| Previous Owner | North Gary L | $200,000 | |
| Previous Owner | Graham Vern E | $163,667 | |
| Previous Owner | Wilson Steven D | $121,000 |
Source: Public Records
Tax History
| Year | Tax Paid | Tax Assessment Tax Assessment Total Assessment is a certain percentage of the fair market value that is determined by local assessors to be the total taxable value of land and additions on the property. | Land | Improvement |
|---|---|---|---|---|
| 2025 | $2,704 | $507,000 | $132,600 | $374,400 |
| 2024 | $2,704 | $500,100 | $124,600 | $375,500 |
| 2023 | $2,704 | $430,300 | $118,500 | $311,800 |
| 2022 | $2,459 | $443,000 | $116,200 | $326,800 |
| 2021 | $2,242 | $343,800 | $101,000 | $242,800 |
| 2020 | $2,153 | $311,300 | $81,800 | $229,500 |
| 2019 | $2,061 | $290,400 | $81,800 | $208,600 |
| 2018 | $1,778 | $260,800 | $81,800 | $179,000 |
| 2017 | $1,699 | $238,100 | $72,700 | $165,400 |
| 2016 | $1,681 | $227,700 | $72,700 | $155,000 |
| 2015 | $1,749 | $219,300 | $75,600 | $143,700 |
| 2014 | $1,707 | $209,800 | $73,400 | $136,400 |
Source: Public Records
Map
Nearby Homes
- 627 E 8680 S
- 8732 S 620 E
- 635 Pioneer Ave
- 412 E 8760 S
- 8729 S Leafwood Ln
- 270 E 8680 S
- 8459 S 300 E
- 8722 S Oakwood Park Cir
- 8797 Green Way Unit 3
- 359 E 8400 S
- 8732 S Oakwood Park Cr
- 744 E 8425 S
- 8322 S Levine Ln Unit 111
- 8915 S 660 E Unit 103
- 8390 S 745 E
- 227 E St Germain Way
- 220 E Pioneer Ave
- 194 Pioneer Ave
- 8558 S Center St
- 149 E Pioneer Ave
Your Personal Tour Guide
Ask me questions while you tour the home.